City Sports & Activity Center: Create Functions from Real-World Situation

Students construct linear functions to model real-world situations at a city sports and activity center. Using descriptions, tables, graphs, and data points, they identify rates of change and initial values, write equations in the form y = mx + b, and interpret slope and intercept in context. Aligned to CCSS 8.F.B.4 and ideal for practice or assessment.

Modeling Linear Relationships: City Sports & Activity Center (8.F.B.4)

Help students learn how to construct and interpret linear functions using realistic, connected scenarios from a city-run Sports and Activity Center. In this worksheet, students act as operations analysts, building linear models to represent costs, usage, and attendance across multiple center services.


This activity focuses on modeling from context, not just identifying equations, making it ideal for mastering CCSS 8.F.B.4.


Short Storyline (Student Context)

A city operates a large Sports and Activity Center and tracks memberships, rentals, attendance, and resource usage using linear models. Different departments record data in descriptions, tables, graphs, and data points. Students analyze this information to build functions that help the city understand and predict costs and usage.


What Students Will Do

Across several connected scenarios, students will:

  • Read real-world descriptions and data
  • Identify the rate of change (slope)
  • Identify the initial value (y-intercept)
  • Construct linear functions in the form y = mx + b
  • Use tables, graphs, and data points to build models
  • Interpret what slope and intercept mean in context
  • Make predictions using their equations


Scenarios Included

All problems fit within one consistent context:

  • Membership fees at the sports center (build function from word problem)
  • Gym locker rental costs (build function from table)
  • Swimming pool water usage (build function from two points)
  • Fitness class attendance growth (build function from graph)
  • Equipment rental charges (build function from word problem)


Each scenario highlights a different way linear relationships appear in real life.


Skills & Standards Covered

  • Construct linear functions from real-world situations
  • Determine rate of change and initial value from:
  • Written descriptions
  • Tables
  • Graphs
  • Two data points
  • Interpret slope and y-intercept in context
  • Write and use equations to make predictions


Aligned to CCSS: 8.F.B.4


Why Teachers Love This Worksheet

  • Strong emphasis on modeling, not memorization
  • Uses one cohesive, realistic context
  • Clear progression from information → equation → interpretation
  • Perfect for interactive and auto-graded platforms
  • Supports randomization, giving each student unique values
  • Encourages mathematical reasoning and explanation
  • Works well for classwork, homework, or assessment


Learning Objective

Students will construct linear functions to model real-world relationships by determining the rate of change (slope) and initial value (y-intercept) from descriptions, tables, graphs, and data points. Students will write equations in the form y = mx + b and interpret the meaning of slope and intercept in context.

Randomization Available

This worksheet supports randomization, meaning each student may receive different values, tables, graphs, or data points while practicing the same modeling skills. This promotes independent reasoning and reduces copying.

💡 Tip: When assigning this activity to your classroom, you can optionally enable randomization to give each student a unique version of the problems. When you re-assign the same worksheet, each student will get a new set of questions, helping them master the content through repeated practice.

City Sports & Activity Center: Create Functions from Real-World Situation preview
Preview
Grade level
8
Type
Mini Lab (real-world worksheet)
Duration
20 minutes
Auto-graded
Yes
Randomized per student
Yes
Common Core standards
8.F.B.4
Topics
FunctionsUsing Variables in ContextLinear Equations
Tags
Real WorldBusiness MathData Analysis

Related grade 8 activities

More interactive, auto-graded activities on the same standards and topics.

LabGrade 8· 120 min

Food Truck Using Expressions & Functions

Curbside is an interactive Grade 8 math lab where students run a food truck and use real math to decide if it makes money. Across 7 auto-graded worksheets they build revenue, cost, break-even, and profit, compare competitors, and weigh a marketing curve. A hands-on way to make expressions, equations, and functions feel real. Common Core aligned (8.EE, 8.F).

Mini LabGrade 8· 20 min

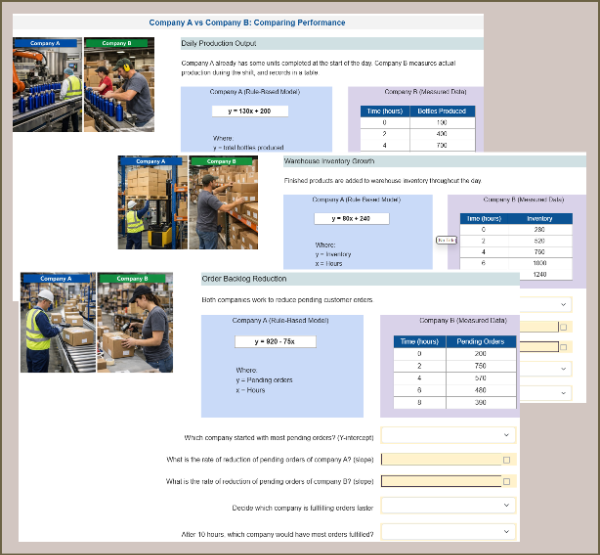
Comparing Delivery Performance: Algebraic & Tabular Functions

Students compare two linear functions represented in different forms: one as an algebraic equation and the other as a table of values. Using real-world company operations like production, inventory, and order fulfillment, students identify slopes and intercepts to determine which function changes faster and justify their reasoning.

Mini LabGrade 8· 20 min

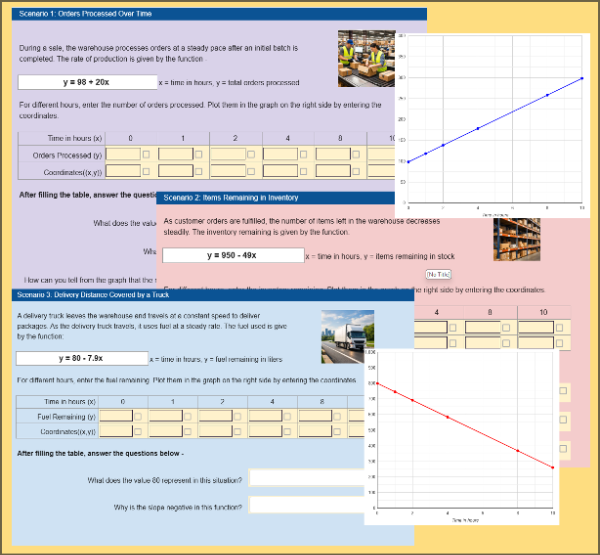
E-Commerce Operations: Graphing Linear Functions

Analyze real-world warehouse operations by graphing given linear functions in this interactive worksheet. Students create tables, plot ordered pairs, and interpret slopes and y-intercepts for orders processed, inventory remaining, and fuel usage. Aligned to CCSS 8.F.A.1, this activity builds strong graphing and function interpretation skills through a realistic e-commerce storyline.

Mini LabGrade 8· 20 min

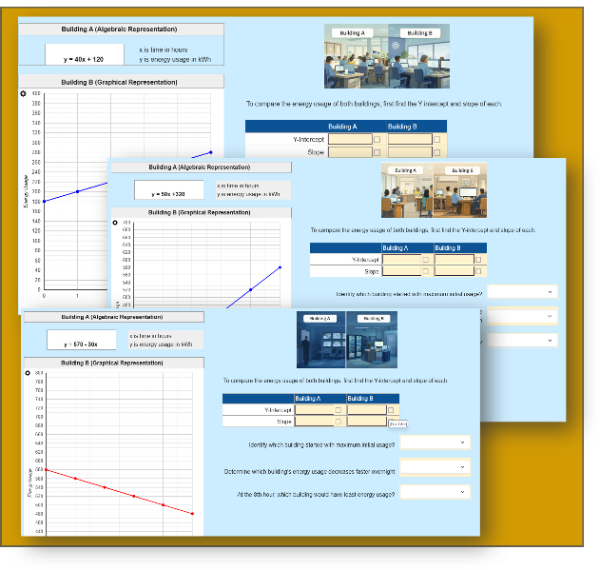
Energy Use: Comparing Algebraic and Graphical Representation

Students compare two linear functions represented in algebraic and graphical form to determine which changes faster. Using real-world energy usage scenarios, students identify slopes and y-intercepts, interpret positive and negative rates of change, and justify comparisons. Aligned to CCSS 8.F.A.2 and ideal for practice or assessment.

Mini LabGrade 8· 20 min

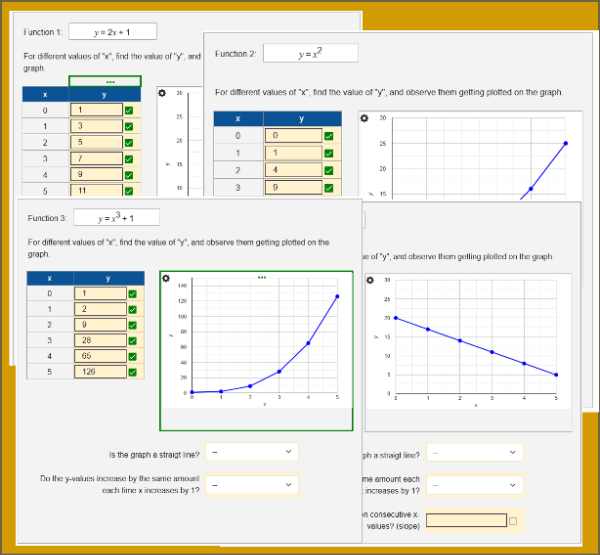
Is It Linear? Discovering Straight-Line Functions

Students explore linear and non-linear functions by completing tables, observing graphs, and analyzing equations. They identify straight-line graphs, constant rates of change, and the structure of y=mx+b, then explain why other functions are not linear. Aligned to CCSS 8.F.A.3 and ideal for practice or assessment.

Mini LabGrade 8· 20 min

Physics Lab Data: Graphing Functions

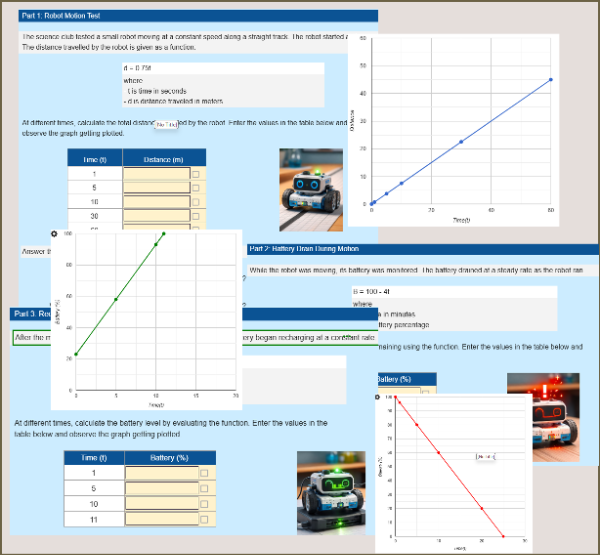
Analyze real physics experiments using linear functions in this interactive worksheet. Students graph given functions for robot motion, battery drain, and battery charging, then interpret slopes and intercepts in context. Aligned to CCSS 8.F.A.1, this activity builds strong intuition for functions through meaningful graphs and real-world data.