Graph proportional relationships, interpreting the unit rate as the slope of the graph. Compare two different proportional relationships represented in different ways. For example, compare a distance-time graph to a distance-time equation to determine which of two moving objects has greater speed.
6 interactive, auto-graded activities for 8th grade students practising 8.EE.B.5. Mini Labs put the standard to work in a real scenario; Skill Practice builds fluency on the standard alone. Every one is randomized per student, so each learner gets their own numbers.
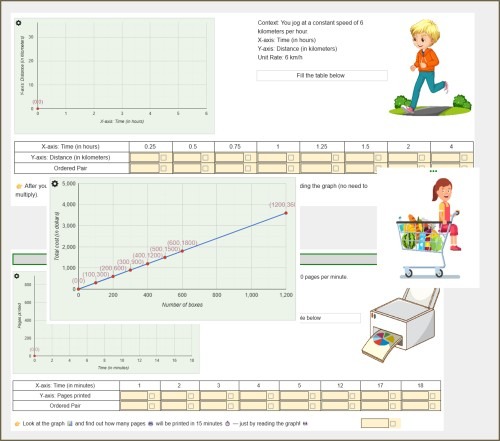
Students explore proportional relationships by completing tables and graphs for real-world scenarios like jogging and packaging costs. They’ll use unit rates, plot ordered pairs, and observe how proportional relationships form straight lines through the origin.
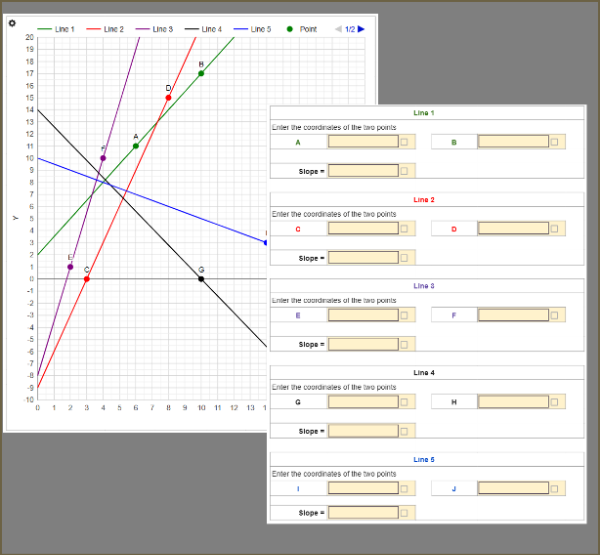
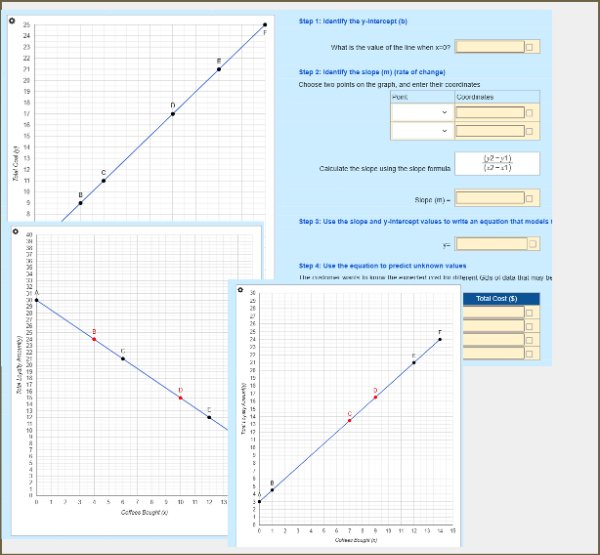
Help students master slope using real graphs. In this interactive worksheet, learners identify coordinates, apply the slope formula, and compare slopes of multiple lines. Supports randomization so each student receives different lines and points, making it perfect for 8th-grade slope practice.
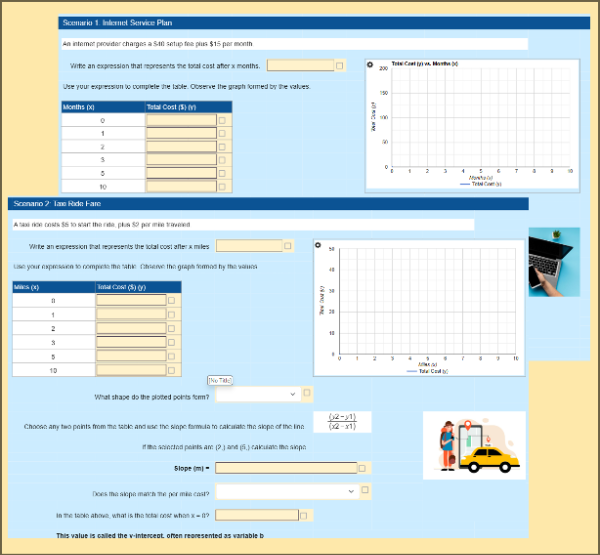
Help students understand linear relationships through real-world scenarios. In this worksheet, learners write expressions, complete tables, analyze graphs, and identify slope as the unit rate and the y-intercept as the starting value. A strong conceptual bridge leading to the equation y = mx + b.
Students explore real-world linear relationships by analyzing graphs, identifying slope and y-intercept, and writing equations in slope-intercept form. Using real data from everyday scenarios, they model situations, create equations, and predict unknown values. Ideal for building conceptual understanding of y=mx+b.
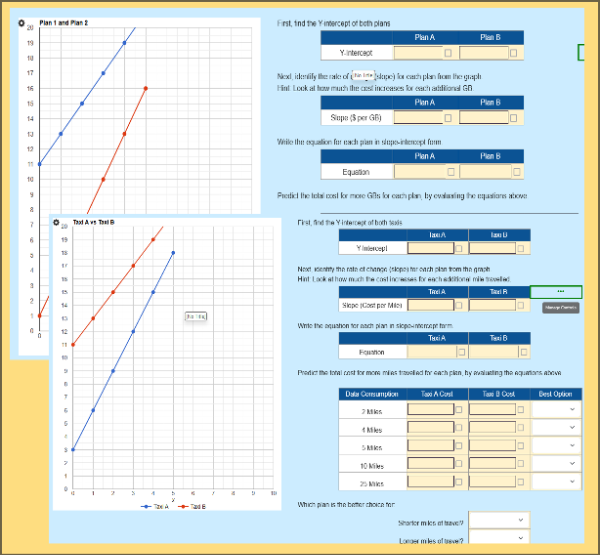
Students compare real-world linear models by analyzing graphs, identifying slope and y-intercept, writing equations in slope-intercept form, and predicting values. Through an internet plan comparison, learners use equations to determine the better option for low and high usage, building strong conceptual understanding of linear relationships.
Curbside is an interactive Grade 8 math lab where students run a food truck and use real math to decide if it makes money. Across 7 auto-graded worksheets they build revenue, cost, break-even, and profit, compare competitors, and weigh a marketing curve. A hands-on way to make expressions, equations, and functions feel real. Common Core aligned (8.EE, 8.F).