
Grade 7 · Common Core · in teaching order
7th grade math activities & worksheets
Every 7th grade topic is a ready-to-teach path: warm-up, practice, real-world application, review. Every activity is interactive, auto-graded, and randomized per student, and each one is tagged to its Common Core standard. Prefer to start from a standard? Browse 7th grade standards.
Ratios & Proportional Relationships
2
Mini Lab
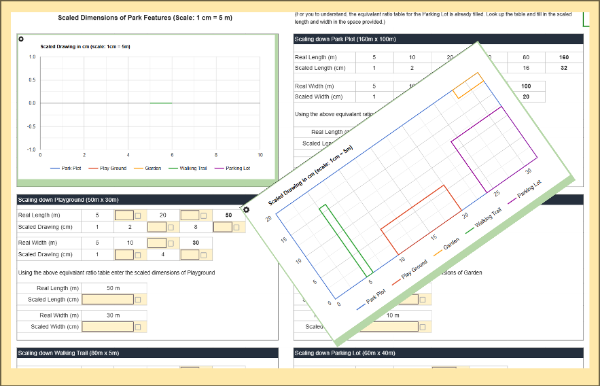
City Park Design Using Equivalent RatiosIn this hands-on activity, students use equivalent ratios to scale down real-world park dimensions and see their design come to life in an automatically generated graph. As they convert measurements, complete ratio tables, and analyze the final layout, they build fluency in proportional reasoning and visual interpretation.
3
Mini Lab
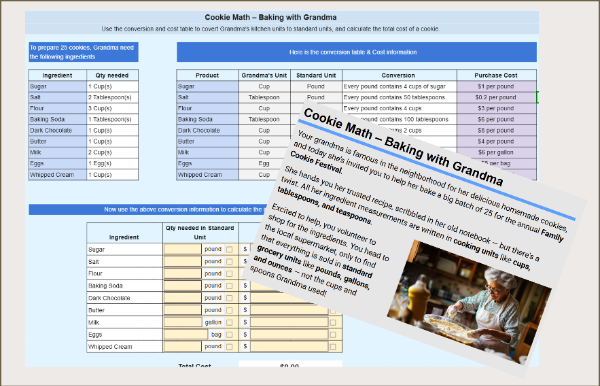
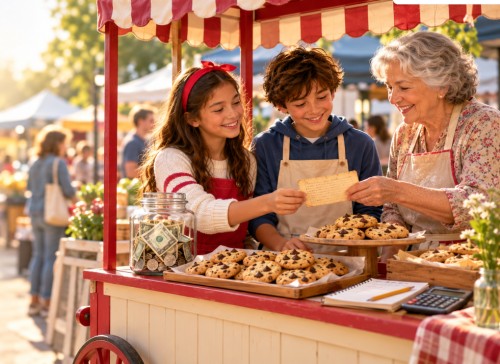
Cookie Ratios – Baking with Grandma’s RecipeIn this real-world math activity, students apply their understanding of ratios and fractions to convert Grandma’s recipe from kitchen units to standard grocery store units. Using a conversion chart and price list, they calculate the quantity and cost of each ingredient, determine the total expense for 25 cookies, and find the cost of one cookie.
4
Mini Lab
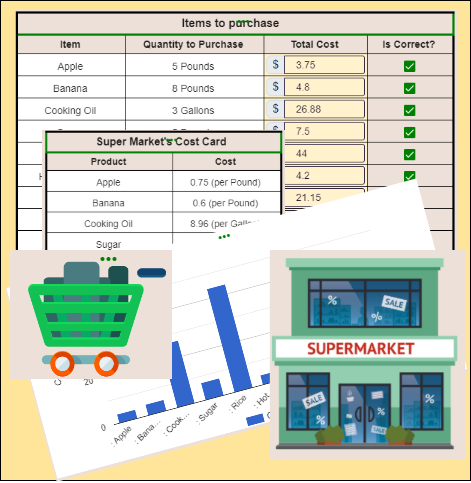
Decimals: Computing the Total Purchase CostIn this real-world math activity, students calculate the total cost of grocery items using unit rates and determine if their $100 budget is enough. Perfect for practicing decimals, multiplication, and proportional reasoning.
5
Mini Lab
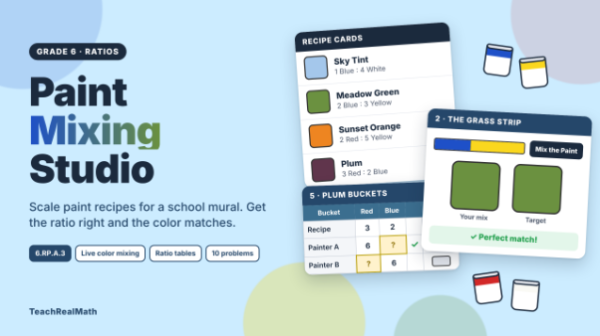
Paint Mixing StudioGrade 6 ratio worksheet: students run the paint station for a school mural. They scale paint recipes with equivalent ratios, complete ratio tables, then press Mix the Paint to see their color beside the target. A wrong ratio looks wrong! Ends with students inventing their own color and filling a customer order. Auto-graded, randomized. CCSS 6.RP.A.3.
6
Mini Lab
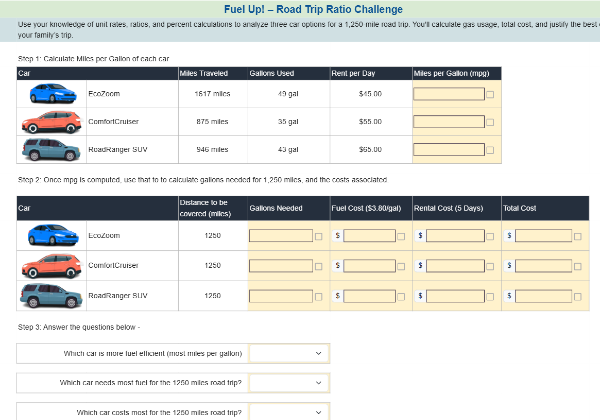
Fuel Up! – Road Trip Ratio ChallengeIn this real-world math challenge, students use ratio and unit rate skills to plan a 1,250-mile road trip. They analyze past vehicle data, calculate miles per gallon, total costs, and compare options to choose the most cost-effective car.
7
Skill Practice
Proportional Relation– Build the Graph8

Activity
Calculate Rates - Real-Life Scenarios Students will calculate rates based on various real-life scenarios. Examples include determining the average speed in miles per hour or the cost per apple. These problems help students apply their understanding of ratios and rates in practical situations, reinforcing their ability to solve real-world problems involving proportional reasoning.
9
Mini Lab
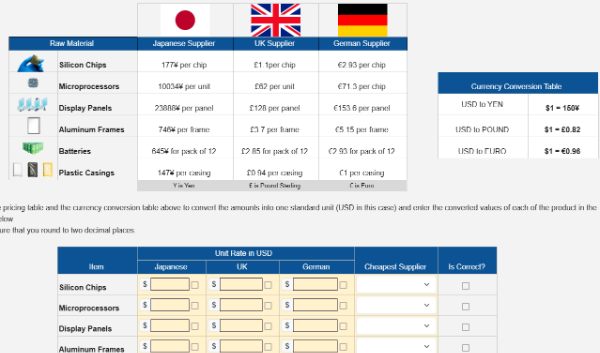
Global Manufacturing - Raw Material Cost Comparison Students act as the CEO of a company, to find the cheapest country to purchase the raw materials, students will do unit conversion between different currencies.
10

Mini Lab
The Big Barbecue Day: Unit RatesStudents will find the unit rate of seven products in three stores - Farm Fresh, Market Bargain, and Quality stores. They will compare the unit prices and find the cheapest store to purchase each ingredient.
Seasonal shelf · 5 activities, shown in season
NovemberBudgeting for Thanksgiving Feast20 min
SeasonalCommunity Kitchen - Weekly Budget Planning20 min
OctoberHalloween Races : Speed, Distance & Time20 min
DecemberSanta’s Workshop: Multi-Step Operations & Ratios45 min
OctoberThe Haunted House Math Adventure45 min
1
Mini Lab
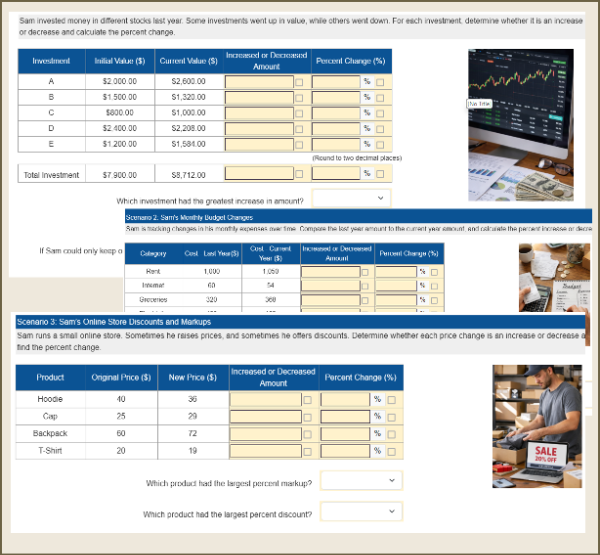
Percent Changes in Sam’s Financial LifeStudents analyze real-world financial situations to calculate percent increase and decrease. Using a connected storyline, students examine changes in stock investments, monthly expenses, and online store prices. This worksheet builds proportional reasoning through table-based problems and supports randomized values for independent, auto-graded practice.
2
Mini Lab
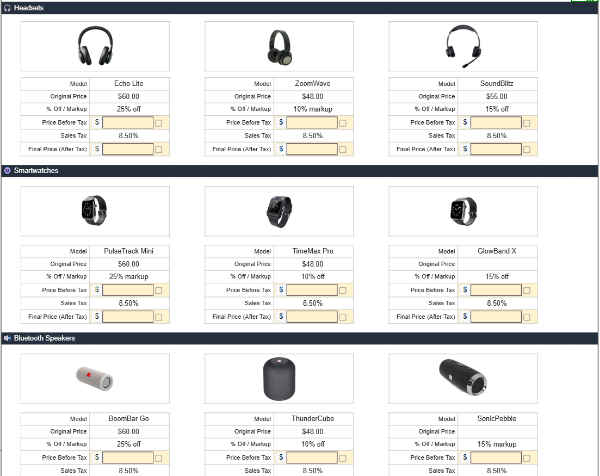
Shopping Spree – Discounts, Deals & DecisionsIn this real-world math challenge, students use percent skills to shop smart at a tech store. They apply discounts, markups, and sales tax to build a tech bundle within a $150 budget, developing proportional reasoning and financial literacy.
3
Mini Lab
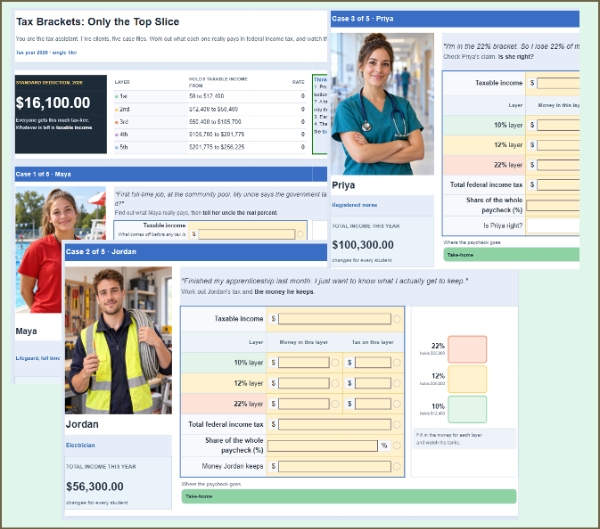
Percent in Action: How Tax Brackets Really WorkStudents become tax assistants for five clients, from a lifeguard to a nurse, and calculate federal income tax with real 2026 IRS brackets. Using percent of a number, they fill each tax layer, find total tax and the true share of pay, and bust the myth that a raise can cost you money. Auto-graded, randomized per student, with a student-read intro deck. Grades 7-8, 20-30 min.
4

Mini Lab
Simple Interest: Saving for your dream houseStudents will use the simple interest formula and its variations to find the interest, principal to be deposited, and the interest rate they should be looking for to get $100,000 after 10 years for their dream house.
5
Mini Lab
Simple Interest: Saving for your dream houseStudents will use the simple interest formula and its variations to find the interest, principal to be deposited, and the interest rate they should be looking for to get $100,000 after 10 years for their dream house.

Seasonal shelf · 4 activities, shown in season
DecemberBake and Share: A Budget-Friendly Christmas Cake20 min
Late NovemberBlack Friday Shopping – Discount Decision Maker20 min
Late NovemberBlack Friday: Mastering Discounts and Budgets50 min
OctoberMarkup & Discounts - Boo-tique: Three Weeks to Halloween30 min
The Number System
1
Skill Practice
Integer Addition & Subtraction on the Number Line2
Mini Lab
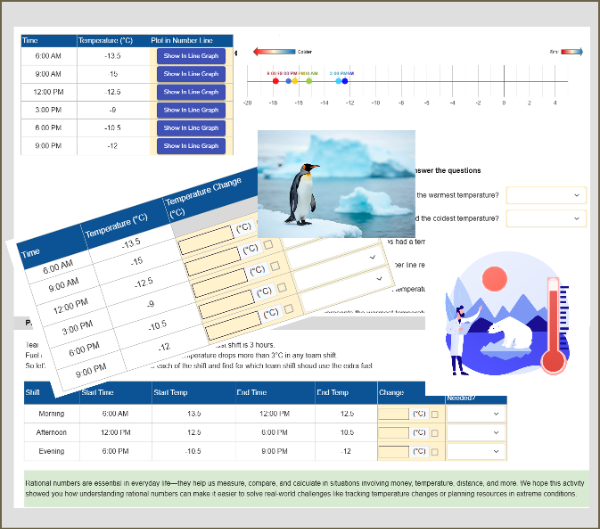
Antarctica Temperature: Rational Number OperationsTrack real-world temperature changes in Antarctica while learning how to add and subtract rational numbers. Students plot values on a number line, analyze patterns, and apply math to freezing-cold data!
3
Mini Lab
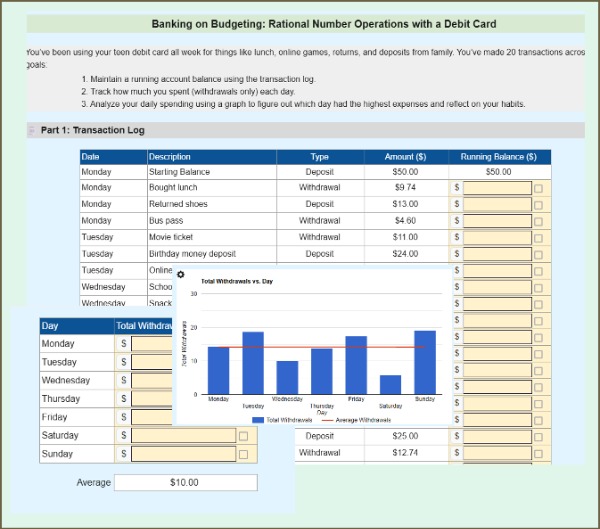
Bank Transactions: Rational Number OperationsIn this budgeting simulation, students manage a week's worth of debit card transactions using addition and subtraction of rational numbers, track their account balance, calculate daily spending, and analyze patterns in their financial habits.
4
Mini Lab
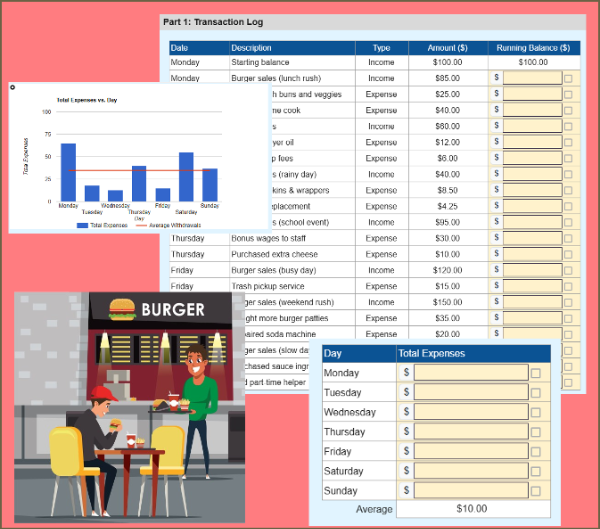
Restaurant Finance Manager: Rational Number OperationsStudents take on the role of a restaurant’s financial manager, tracking income and expenses, calculating a running balance, and analyzing spending patterns using rational number addition and subtraction and using graphs.
5
Seasonal shelf · 1 activity, shown in season
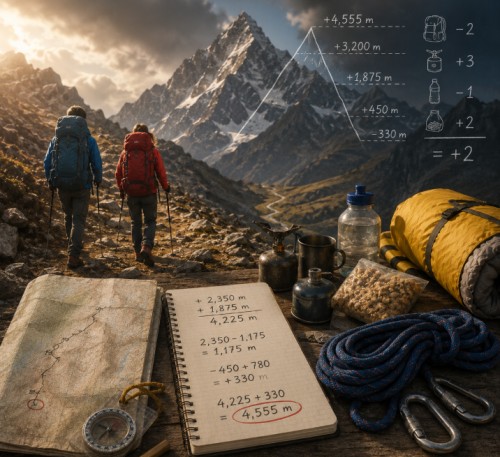
DecemberSanta’s Journey: Route Optimization Quest60 min
1
Mini Lab
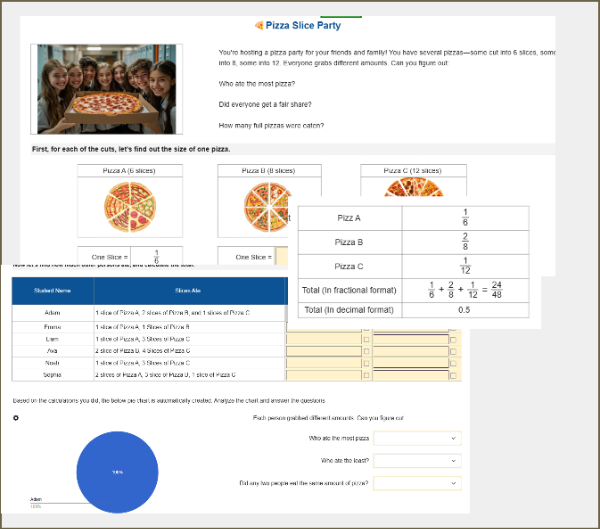
Pizza Slice Party: Fractions & DecimalsA fun and visual worksheet where students calculate how much pizza each person ate using fractions and decimals. Perfect for practicing proportional reasoning, comparisons, and data interpretation with minimal text and maximum engagement.
2
Mini Lab
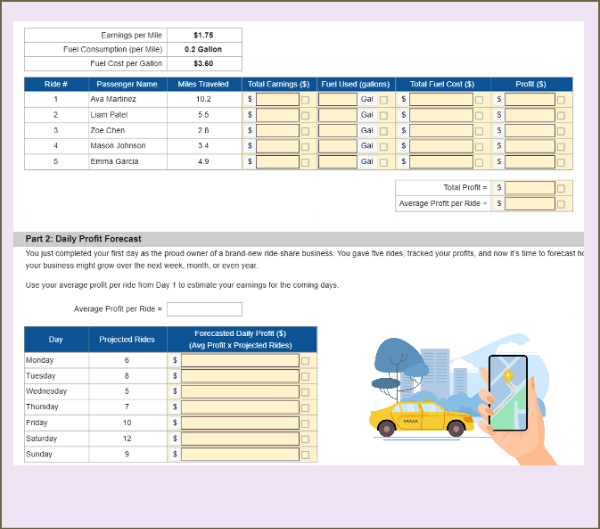
Ride-Share Profits: Multiplying Rational NumbersStudents run a ride-share business, calculating profits using multiplication and division of rational numbers. They analyze real-world costs, earnings, and forecast long-term success using math.
3
Mini Lab
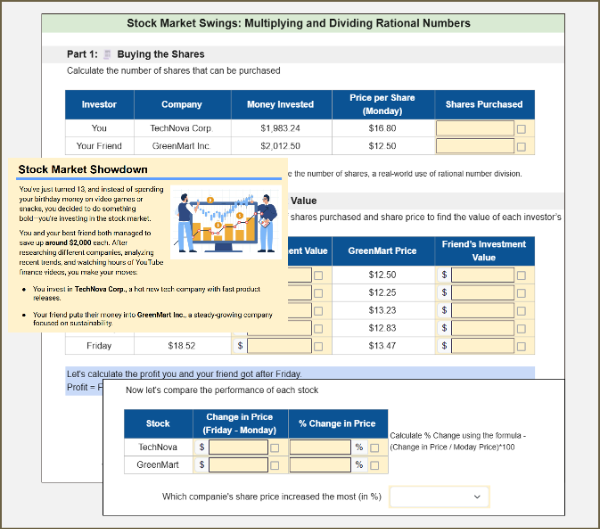
Stock Market Swings: Multiply & Divide Rational NumbersIn this engaging simulation, students use multiplication and division of rational numbers to track and compare two stock investments over five days—calculating share quantities, portfolio values, and final profits.
4
Skill Practice
Integer Multiplication: Fill the Sign Grid5
Skill Practice
Integer Division Puzzle6
Skill Practice
Decimal Division Puzzle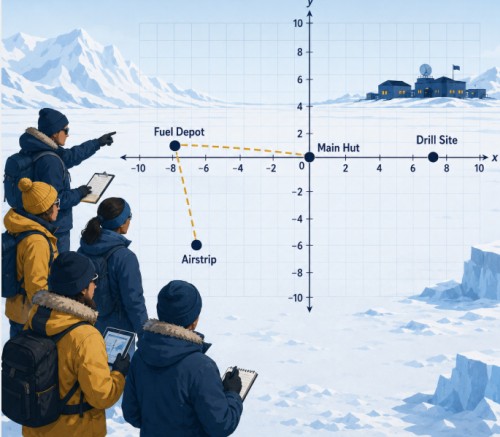
Expressions & Equations
1
Skill Practice
Simplify It! Using the Distributive Property2
Skill Practice
Writing Expressions from Real-World Scenarios3
Mini Lab
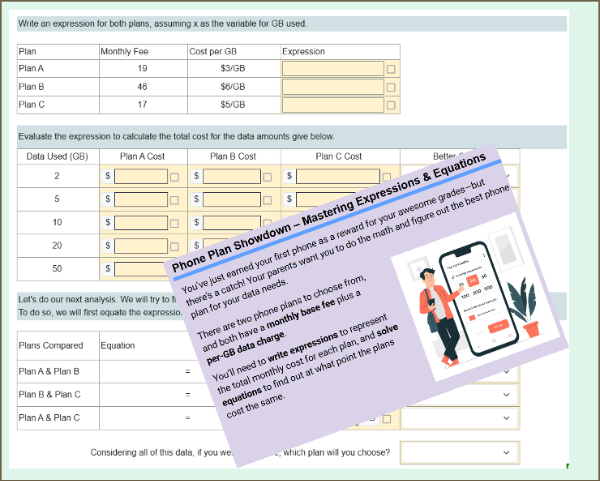
Phone Plan Showdown – Mastering Expressions & EquationsStudents compare three different phone plans by writing algebraic expressions to model their monthly cost. They evaluate these expressions for different data usage amounts and determine at what point one plan becomes more economical than the others.
4
Mini Lab
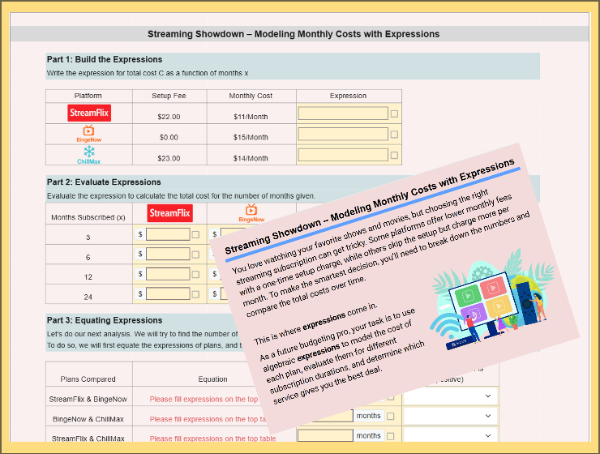
StreamFlix vs. BingeNow – Write & Evaluate ExpressionsStudents compare three streaming services by writing and evaluating algebraic expressions that model total subscription costs over time. They determine which plan is most cost-effective and justify their choice using math.
1
Skill Practice
Balancing Equations with a Virtual Scale2
Skill Practice
Solving Equations with Rational Numbers3
Skill Practice
Solving Equations: Real-World Word Problems4
Mini Lab
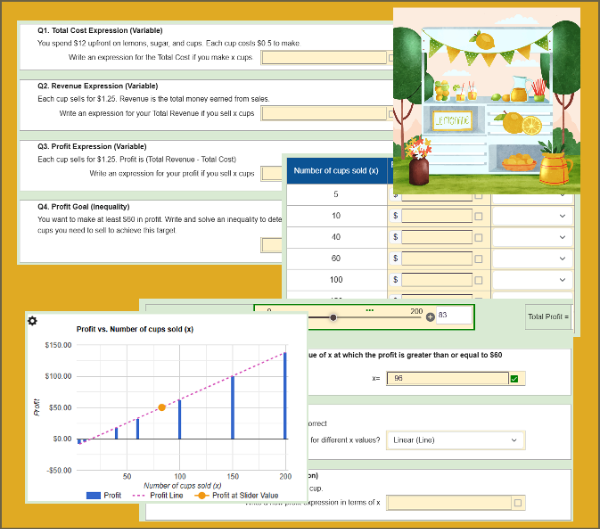
Lemonade Stand: Profit Using ExpressionsHelp plan a lemonade stand by writing expressions for cost and profit, solving inequalities to reach a profit goal, and analyzing how the number of cups sold affects earnings. Students build a table, plot a linear graph, and use a slider to visualize how profit changes—making math both real and interactive!
5
Mini Lab
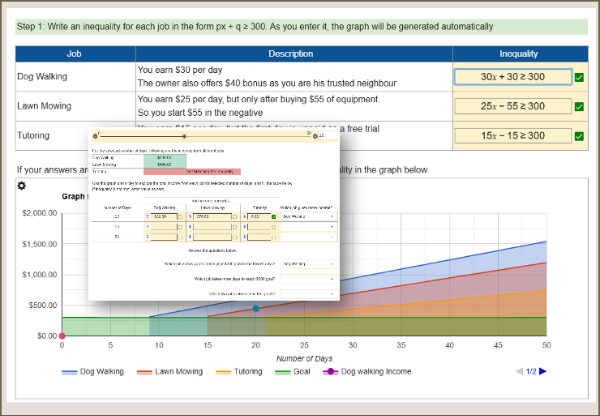
Real-World Inequalities: Which Job Gets You to $300 Fastest?Students write and solve inequalities representing real-world side jobs, then analyze automatically generated graphs to compare job outcomes and make decisions based on visual and numerical insights.
1
Mini Lab
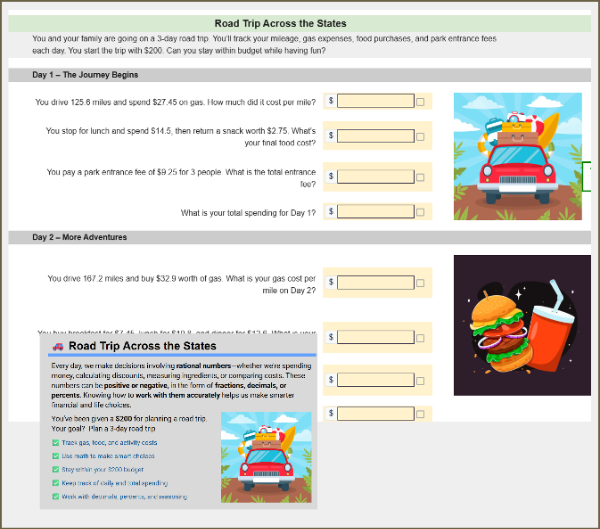
Road Trip Across the States: Rational OperationsTrack your budget on a 3-day road trip by calculating gas costs, food expenses, and entrance fees. Students solve multi-step problems using decimals and precents to stay within a $200 budget.
Seasonal shelf · 1 activity, shown in season
SeasonalBack to School Shopping: Rational Operations15 min
Geometry
1
Mini Lab
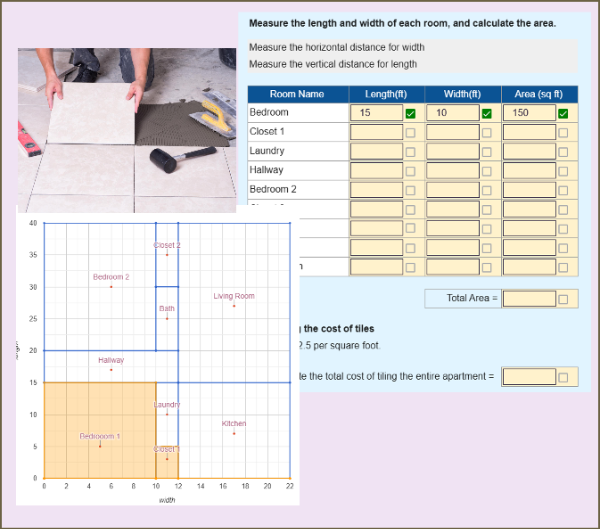
Tiling Estimation for Given Floor PlanStudents measure room dimensions from a coordinate grid-based floor plan, calculate area, and determine the total cost of tiling the apartment. A practical geometry task that connects math to real-world construction!
2
Mini Lab
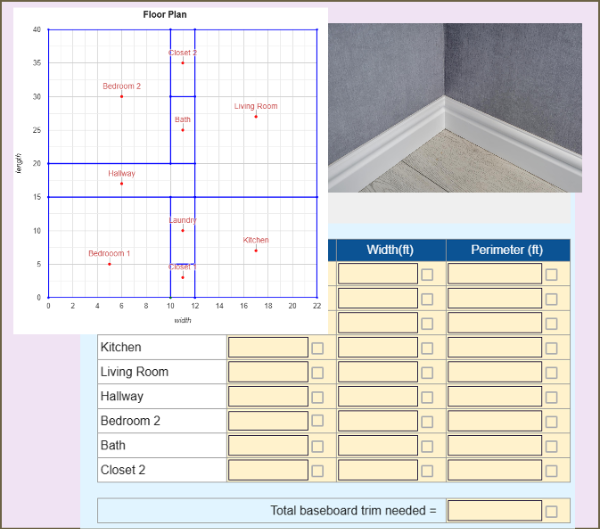
Baseboard Trim Estimation: PerimeterStudents use a floor plan on a coordinate grid to measure room dimensions, calculate perimeter, and estimate the total length and cost of baseboard trim needed for an apartment renovation. A hands-on geometry application!
3
Mini Lab
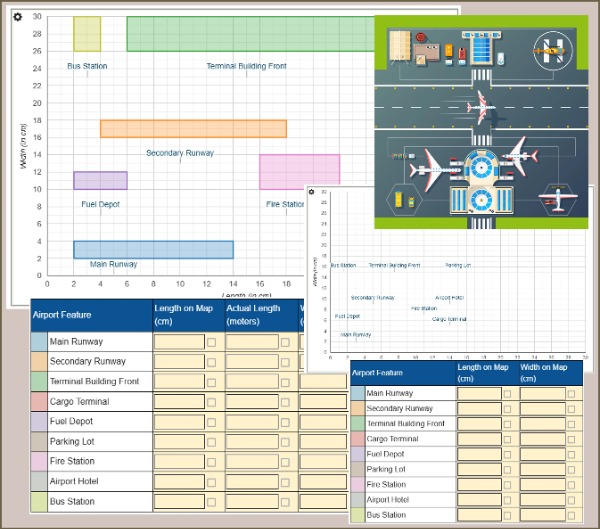
Scale Drawings: Convert and Rescale Airport LayoutIn this interactive geometry activity, students measure features on a scale map, convert to real-world dimensions, then rescale the layout for a presentation. Visual feedback confirms correct answers instantly. A hands-on way to apply proportional reasoning and scaling!
4
Mini Lab
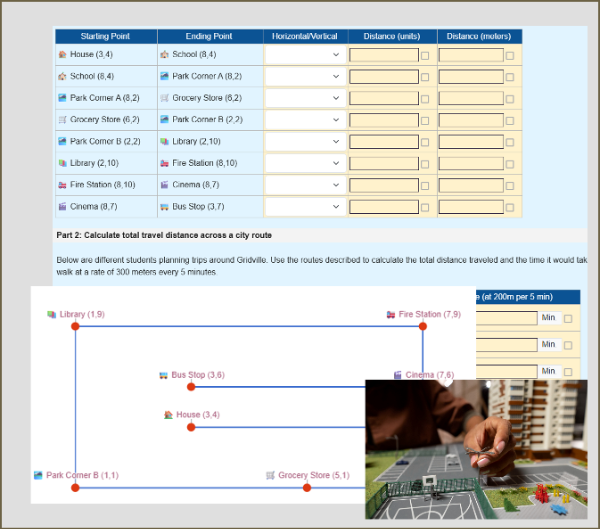
Scaling the City - Coordinate GeometryStudents use a city map on a coordinate grid to calculate real-world distances between locations, convert grid units to meters, and determine travel times—bringing coordinate geometry to life through practical navigation tasks.
5
Skill Practice
4-Quadrant Coordinate Mystery: Number 67Seasonal shelf · 1 activity, shown in season
SeasonalBack to School: My Coordinate Story10 min
1
Skill Practice
SLICE IT: Cross-Sections of Solids2
Skill Practice
Real-World Problems Involving Volume3
Skill Practice
Area of Composite Figures – Real-World Word Problems4
Mini Lab
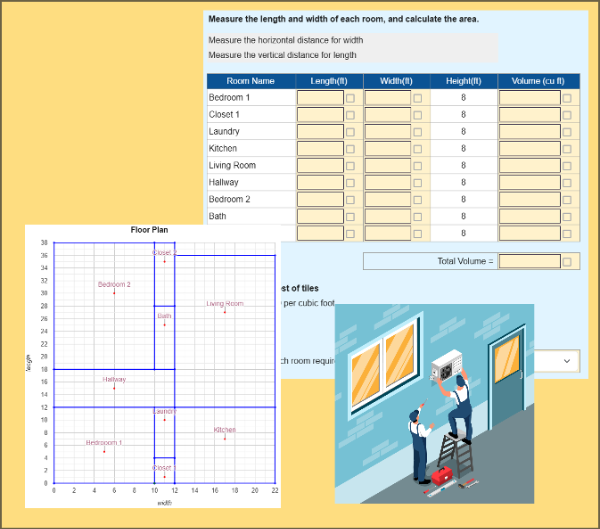
Volume Estimation for HVAC PlanningStudents use a floor plan to calculate the volume of rooms by measuring dimensions and applying the formula for volume of rectangular prisms. They then estimate the HVAC cost, connecting geometry to real-world heating and cooling applications.
5
Mini Lab
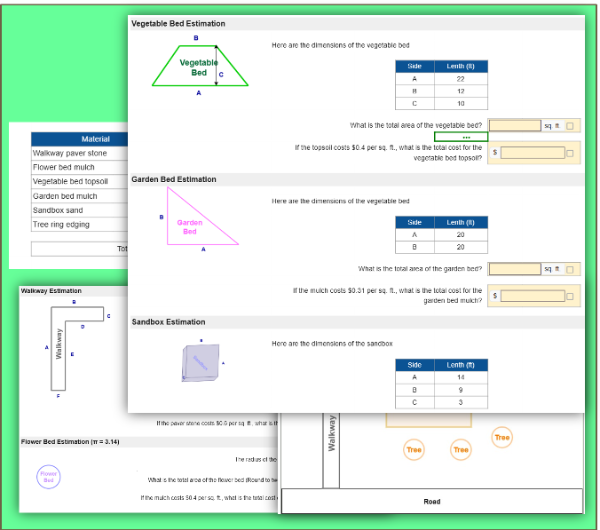
Geometry - Landscaping Cost EstimationIn this real-world geometry activity, students calculate area, volume, and circumference of different landscape features to estimate the total cost of a backyard project. Shapes include rectangles, triangles, trapezoids, circles, and more. A perfect blend of math and practical application!
6
Skill Practice
Geometry: Real-World Problems Worksheet
Seasonal shelf · 1 activity, shown in season
DecemberA Geometric Christmas: Home Decoration20 min
1
Skill Practice
Triangle Builder: One, Many, or None?2
Activity
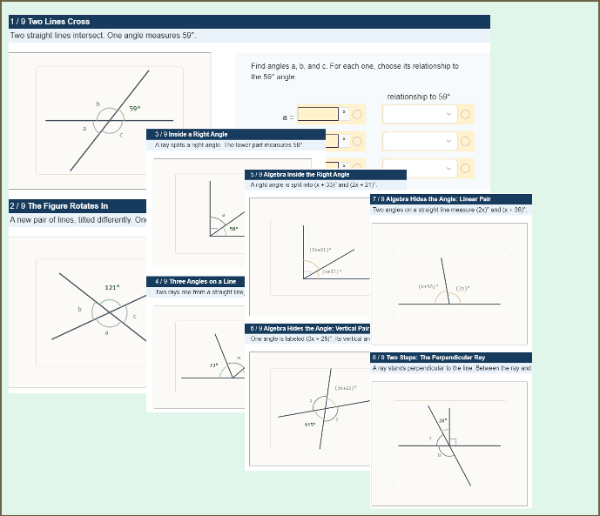
Angle Detective: Vertical, Adjacent, Complementary, and Supplementary AnglesAngle Detective is an interactive, auto-graded worksheet for 7th grade geometry (7.G.B.5). Students use vertical, adjacent, complementary, and supplementary relationships to find unknown angles, then write and solve equations for angles hidden behind algebra. Correct answers ink into the figure in real time. Every student gets a randomized version, so no two worksheets are the same.
3
Mini Lab
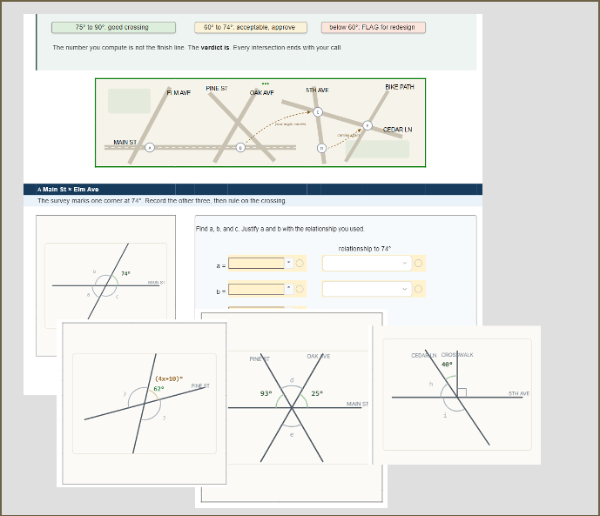
City Intersections: Real-World Angle RelationshipsCity Intersections is an interactive, auto-graded worksheet for 7th grade geometry (7.G.B.5). Students act as city surveyors, using vertical, adjacent, complementary, and supplementary angles to check whether street crossings meet the road-safety code. They compute the angles, then deliver a verdict: approve or flag. Every student gets a randomized version, so no two worksheets are the same.
Statistics & Probability
1
Mini Lab
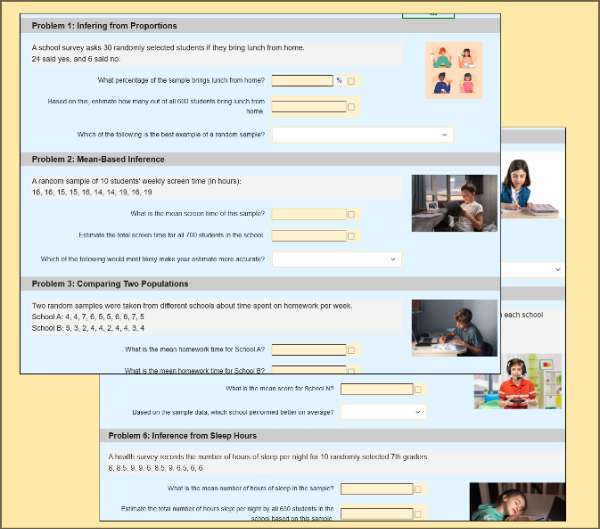
"What Can You Infer?" – Making Predictions from Random SamplesIn this worksheet, students analyze six real-world scenarios involving random samples to make inferences about larger populations. They will calculate proportions, means, and ranges, and reflect on the reliability of their conclusions based on sample size and variability.
2
Mini Lab
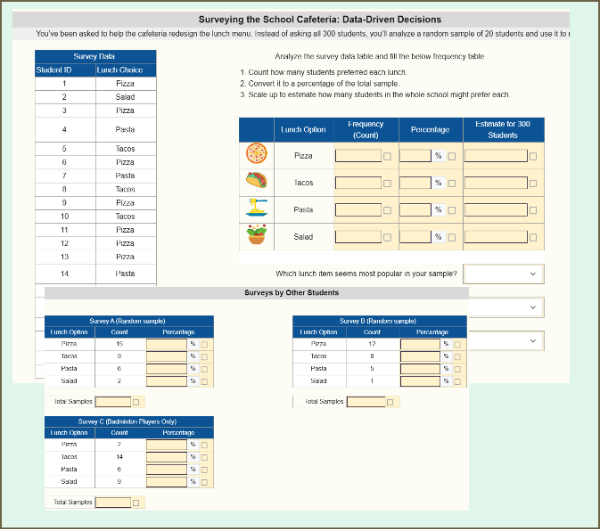
Analyzing Samples - What’s the Most Popular Lunch?Students analyze a random sample of lunch preferences to estimate the most popular food choices in their school. They compare results from multiple surveys—including a biased one—to understand the importance of sample size and randomness in drawing reliable conclusions.
Seasonal shelf · 1 activity, shown in season
SeasonalBack to School: Know Your Classroom20 min
1
Skill Practice
Mean, Median, Mode, Range & IQR2
Skill Practice
IQR: Sort, Split and Find the Middle Half3
Skill Practice
Mean Absolute Deviation Practice4
Skill Practice
Identifying and Analyzing Outliers in Dot Plots5
Mini Lab
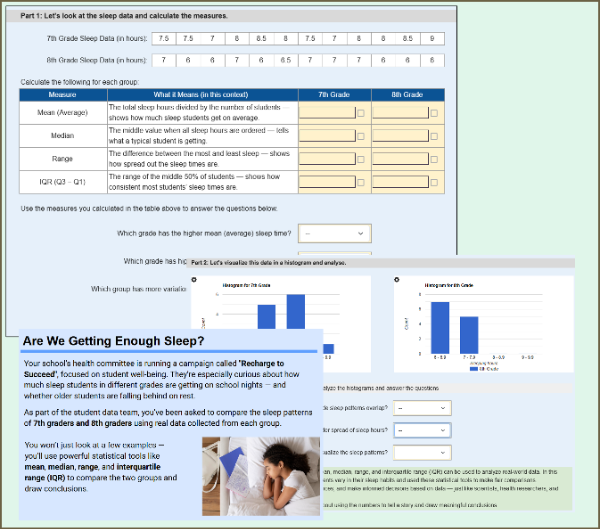
Sleep Patterns: Mean, Median, Range, IQR & HistogramStudents compare the sleep patterns of 7th and 8th graders using real-world data. They calculate mean, median, range, and IQR, then interpret histograms and make informal inferences about group differences.
This worksheet supports randomization, so each student may receive different sleep data.
6
Mini Lab
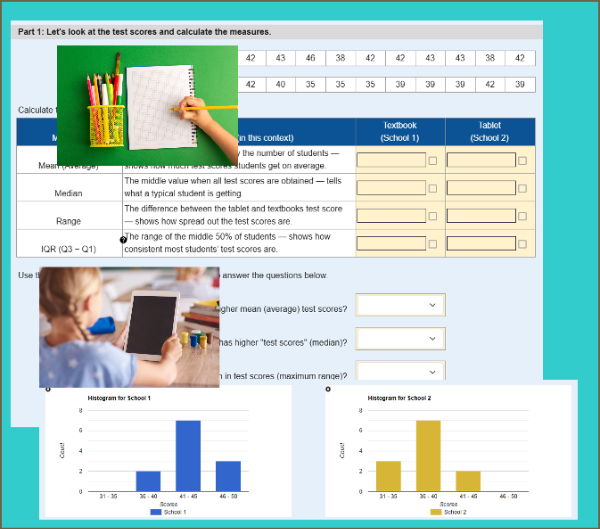
Tablet or Textbook: Mean, Median, Range, IQR & HistogramStudents analyze test score data from two schools — one using tablets, the other using textbooks — to calculate mean, median, range, and IQR. They compare the distributions using numerical measures and histograms to draw conclusions about student performance.
7
Mini Lab
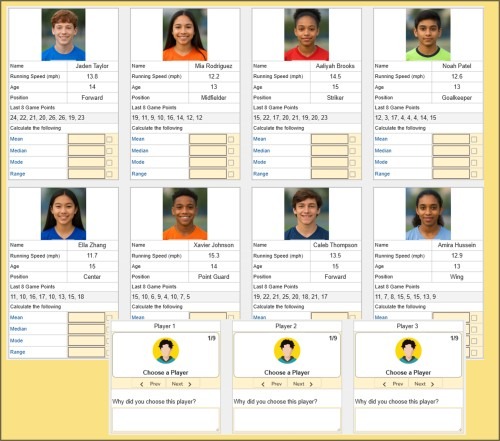
Create Your Dream Team: Sports StatisticsIn this engaging worksheet, students analyze 8 sports players using real-world data. They calculate mean, median, mode, and range of game stats, then select the best 3 players for their dream team. A fun way to apply statistics in decision-making!
8
Skill Practice
Interpreting Dot Plots, Histograms & other graphs.9
Skill Practice
Interpreting Dot Plots10
Skill Practice
Building Box Plots from Real Data1
Mini Lab
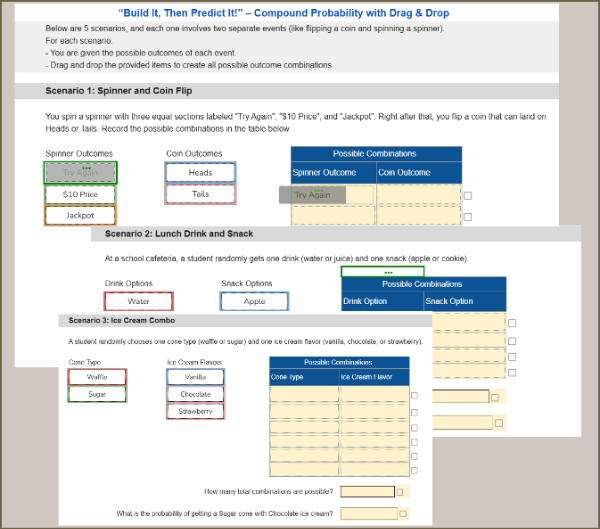
Build It, Then Predict It! – Compound Probability with Drag & DropPractice compound probability by building outcome combinations using drag-and-drop. Students explore real-life scenarios and calculate probabilities from organized tables.
2
Skill Practice
Pick-a-Ball Experimental Probability3
Mini Lab
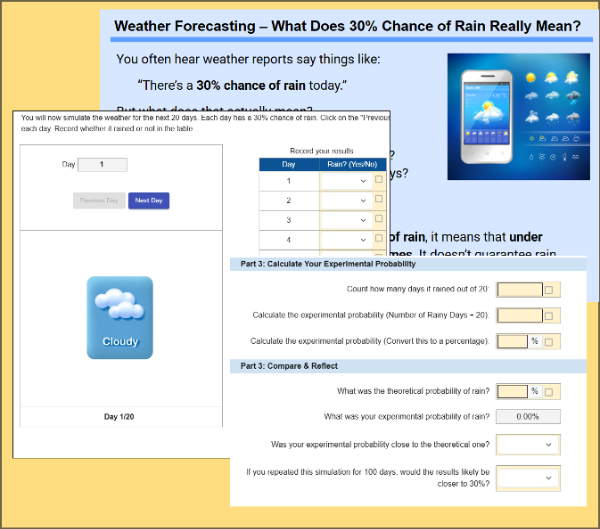
Forecast vs. Reality: Exploring Through SimulationStudents explore how theoretical probability applies to real-world weather forecasting by simulating 20 days of rain predictions. They compare their experimental results to the predicted 30% chance of rain and reflect on what probability really means.
4
Skill Practice
Tree Diagrams and Outcome ListsSeasonal shelf · 1 activity, shown in season
SeasonalCarnival Game Probability: Is It Really Fair?20 min
Seasonal, Other
Seasonal shelf · 1 activity, shown in season
SeasonalSchool Supply Run15 min