Mean Absolute Deviation Practice

Practice calculating the Mean Absolute Deviation (MAD) of a data set step-by-step—starting from the mean, to absolute deviations, and finally to the MAD value.

Help your 7th grade students build a deep understanding of Mean Absolute Deviation (MAD) with this interactive and auto-graded worksheet. Designed to align with Common Core Standard 7.SP.B.3, this hands-on activity walks students through each step of calculating MAD, reinforcing key statistical concepts while offering instant feedback.


Students will:

  • ✅ Calculate the mean of a given data set.
  • ✅ Determine the absolute deviation of each value from the mean.
  • ✅ Compute the average of those deviations to find the MAD.
  • ✅ Analyze and compare variability in different data distributions.


Features of this worksheet:

  • 🔄 Fully auto-graded with immediate feedback to reinforce learning.
  • 🎯 Supports skill mastery in 7th grade statistics and data analysis.
  • 🧠 Encourages conceptual understanding over memorization.
  • 📊 Prepares students for interpreting and comparing real-world data sets.
  • 💡 Ideal for independent practice, formative assessment, or classroom review.


This worksheet is part of our interactive math series and is perfect for building data literacy while keeping students engaged. Teachers can monitor progress in real time and quickly identify where students may need extra support.

Learning Objective

At the end of this worksheet, students will be able to calculate and interpret the Mean Absolute Deviation (MAD) for a given dataset.

Randomization Available

If randomization is enabled when assigning to the classroom, each student will get different set of numbers to find the MAD. This prevents copying of answers and helps individualized learning.

💡 Tip: When assigning this activity to your classroom, you can optionally enable randomization to give each student a unique version of the problems. When you re-assign the same worksheet, each student will get a new set of questions, helping them master the content through repeated practice.

Mean Absolute Deviation Practice preview
Preview
Grade level
7, 8
Type
Skill Practice
Duration
20 minutes
Auto-graded
Yes
Randomized per student
Yes
Topics
StatisticsMeasures of Center and SpreadInterpreting Data
Tags
Practice WorksheetTabular FormatDrill & PracticeBell RingerExit Ticket

Related grades 7, 8 activities

More interactive, auto-graded activities on the same standards and topics.

Mini LabGrades 7, 8· 15 min

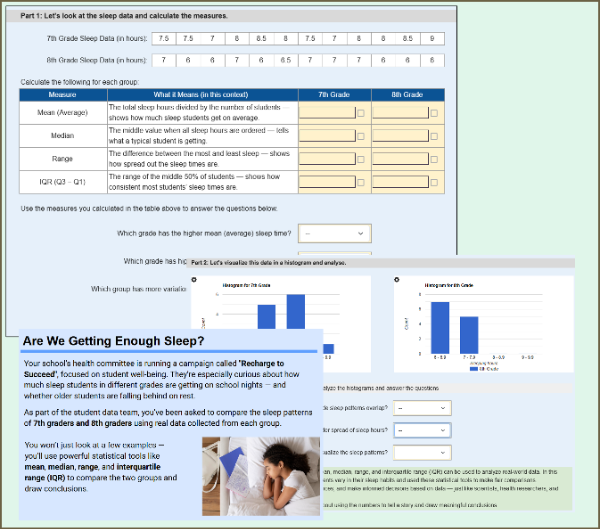
Sleep Patterns: Mean, Median, Range, IQR & Histogram

Students compare the sleep patterns of 7th and 8th graders using real-world data. They calculate mean, median, range, and IQR, then interpret histograms and make informal inferences about group differences. This worksheet supports randomization, so each student may receive different sleep data.

Skill PracticeGrades 6, 7· 15 min

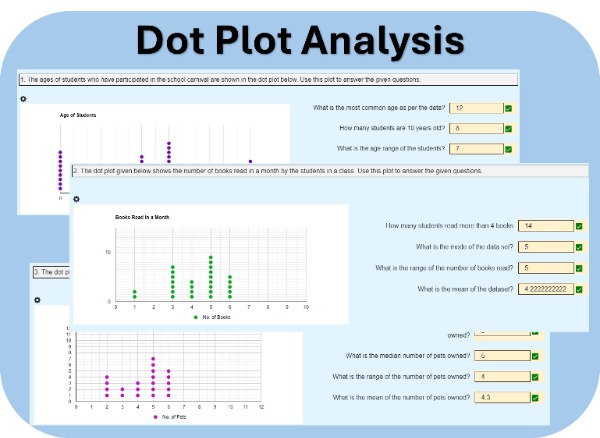
Interpreting Dot Plots

Students will analyze dot plots representing real-world data, such as the ages of students participating in a school carnival. They will answer questions based on these plots. Each student will receive three unique sets of data and questions, encouraging individual analysis and critical thinking.

Skill PracticeGrades 6, 7· 20 min

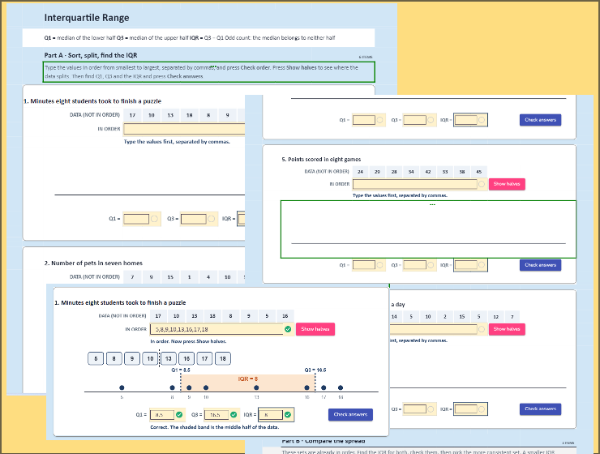
IQR: Sort, Split and Find the Middle Half

Students put a data set in order, split it into halves, and find Q1, Q3 and the interquartile range one guided step at a time. Feedback names the exact mistake, and a number line shades the middle half once they get it right. 8 auto-graded questions, randomized for every student and aligned to 6.SP.B.5c. Assign it for a 20 to 30 minute practice block.

Skill PracticeGrade 7· 20 min

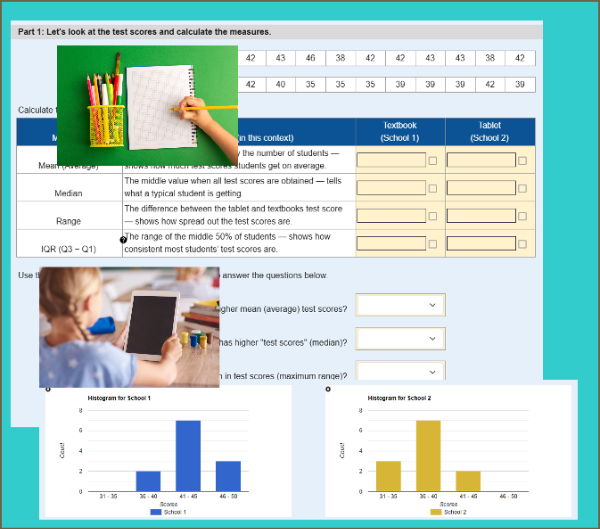
Mean, Median, Mode, Range & IQR

Students will analyze five different data sets, each representing a real-life scenario such as weekly attendance or pages read by students. Their task is to calculate the mean, median, mode, range, and interquartile range for each data set, helping them develop essential skills in statistical analysis.