Middle school math topic

Statistics worksheets and activities for Grades 6 to 8

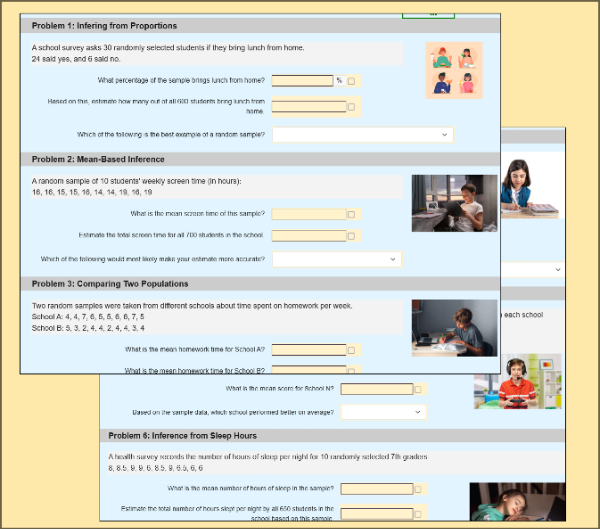
24 interactive statistics activities, each one auto-graded and randomized per student. Mini Labs drop the math into a real scenario students care about; Skill Practice worksheets build fluency on one standard at a time; multi-day Labs connect a whole unit into a single project.

Worksheets: Mini Labs and Skill Practice

Skill PracticeGrades 6, 7, 8· 20 min

Back to School: Know Your Classroom

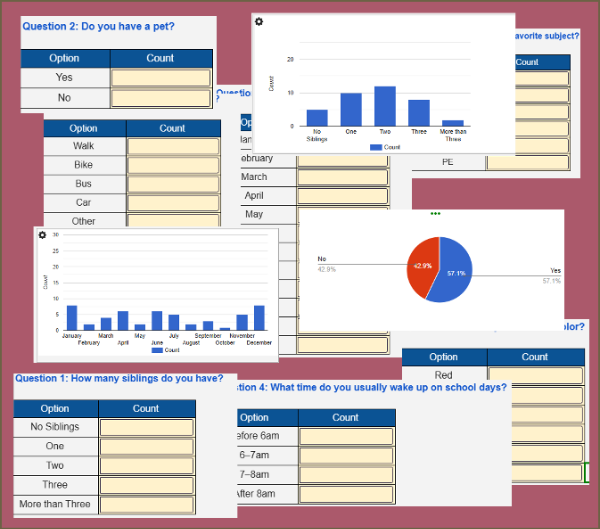
Students collect and summarize data from a live classroom survey on topics like pets, siblings, and school routines. As they enter values, interactive charts update in real time. Students then analyze the graphs and answer summary questions. A fun way to learn data collection and interpretation!
Skill PracticeGrades 6, 7· 20 min

Building Box Plots from Real Data

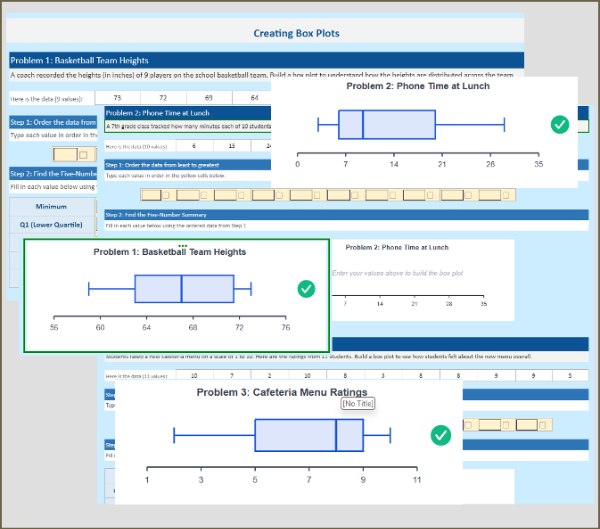
Build fluency with box plots through 3 real-world practice problems. Students sort data, find the five-number summary (Min, Q1, Median, Q3, Max), calculate IQR, and watch the box plot draw itself as they fill in each value. Each problem features a different distribution shape, with instant feedback when answers are correct.

Skill PracticeGrades 6, 7· 15 min

Interpreting Dot Plots

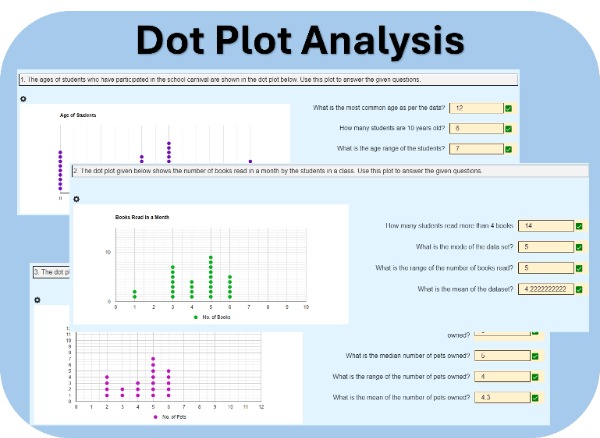
Students will analyze dot plots representing real-world data, such as the ages of students participating in a school carnival. They will answer questions based on these plots. Each student will receive three unique sets of data and questions, encouraging individual analysis and critical thinking.

Worksheets: Mini Labs and Skill Practice

Mini LabGrade 7· 20 min

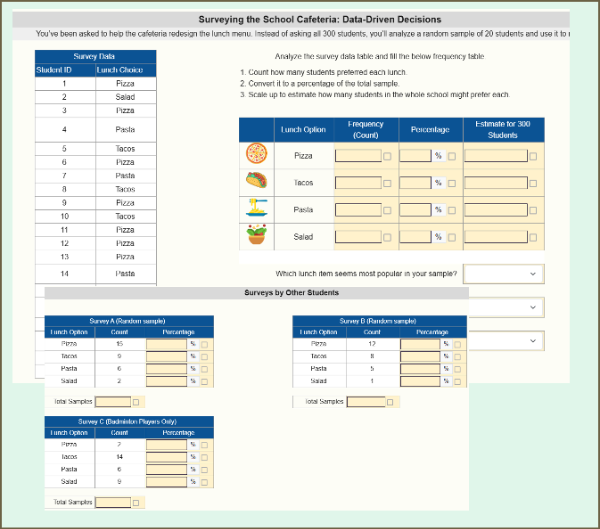
Analyzing Samples - What’s the Most Popular Lunch?

Students analyze a random sample of lunch preferences to estimate the most popular food choices in their school. They compare results from multiple surveys—including a biased one—to understand the importance of sample size and randomness in drawing reliable conclusions.

Skill PracticeGrade 7· 20 min

Mean, Median, Mode, Range & IQR

Students will analyze five different data sets, each representing a real-life scenario such as weekly attendance or pages read by students. Their task is to calculate the mean, median, mode, range, and interquartile range for each data set, helping them develop essential skills in statistical analysis.

Skill PracticeGrade 7· 20 min

Pick-a-Ball Experimental Probability

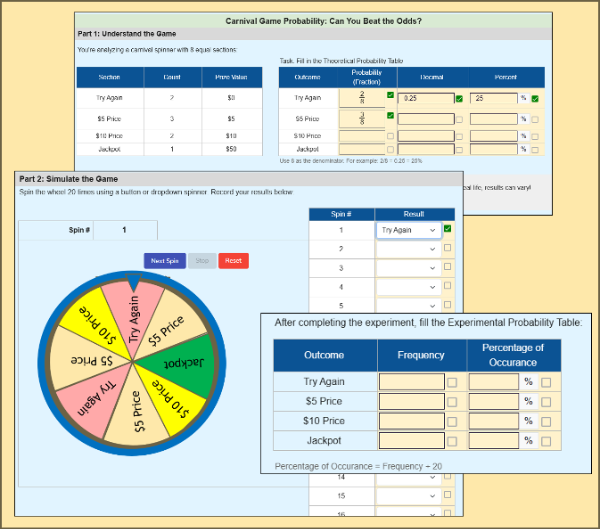
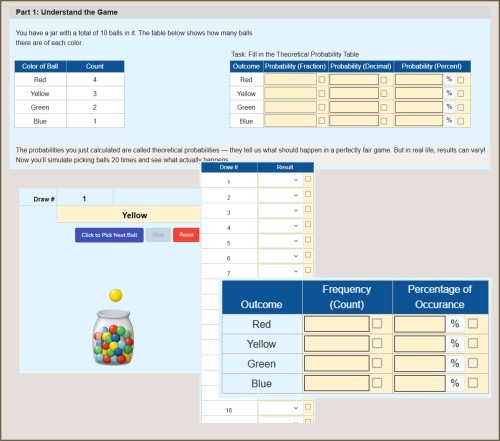
Explore probability through a fun ball-drawing simulation! Students calculate theoretical probabilities, simulate 20 draws from a colored ball jar, record outcomes, and compare results to expected values. A hands-on activity that builds intuition around chance, fairness, and real-world variability.

Mini LabGrades 7, 8· 15 min

Sleep Patterns: Mean, Median, Range, IQR & Histogram

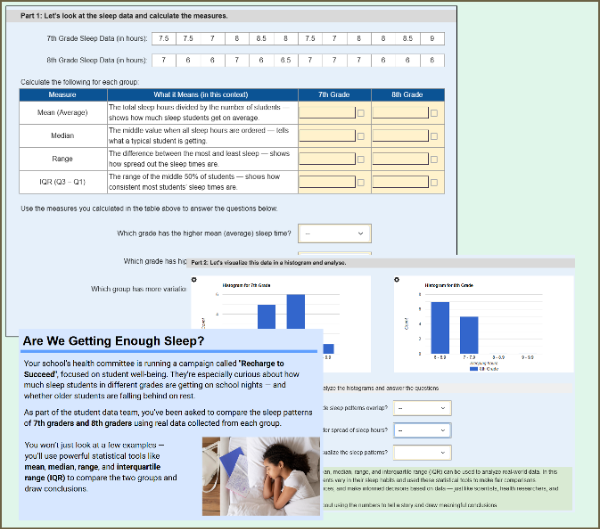
Students compare the sleep patterns of 7th and 8th graders using real-world data. They calculate mean, median, range, and IQR, then interpret histograms and make informal inferences about group differences. This worksheet supports randomization, so each student may receive different sleep data.

Skill PracticeGrade 7· 20 min

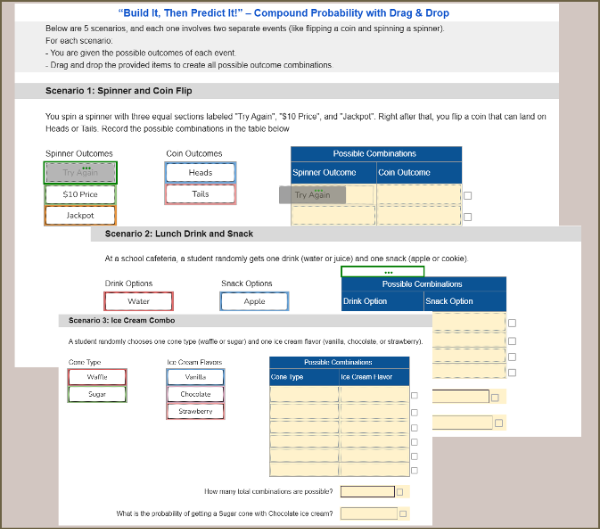
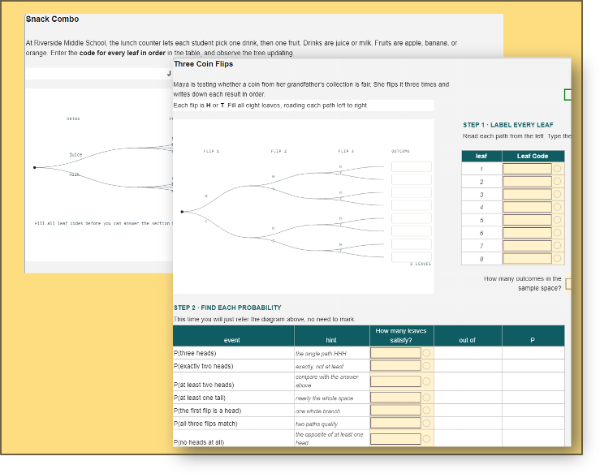
Tree Diagrams and Outcome Lists

Students build each tree diagram themselves, then use it to find the probability of compound events. Three real-world scenarios covering sample space, organized lists, and counting outcomes. Self-checking with instant feedback, so students catch a missing or repeated outcome as they go. Aligned to 7.SP.C.8a. About 20 minutes, no prep.

Worksheets: Mini Labs and Skill Practice

Mini LabGrade 8· 20 min

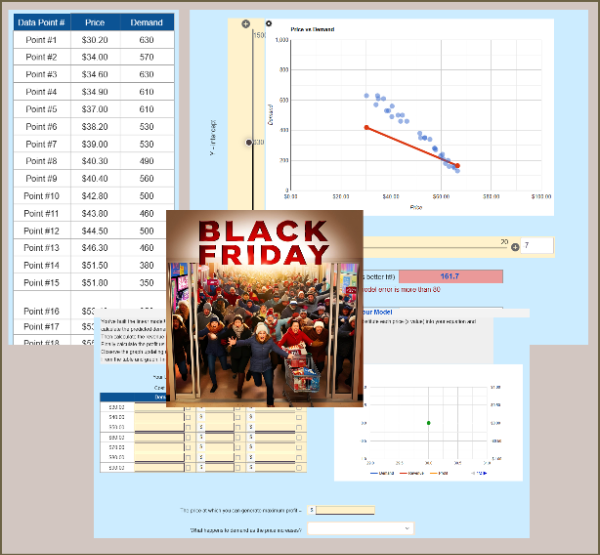
Black Friday Demand Curve & Profit Maximization

Students build a linear model from a price–demand scatterplot, then use it to predict demand, revenue, and profit at different price points. They analyze curves and determine the price that maximizes profit. A perfect real-world 8th-grade activity for scatterplots, linear modeling, and financial reasoning.

Mini LabGrade 8· 20 min

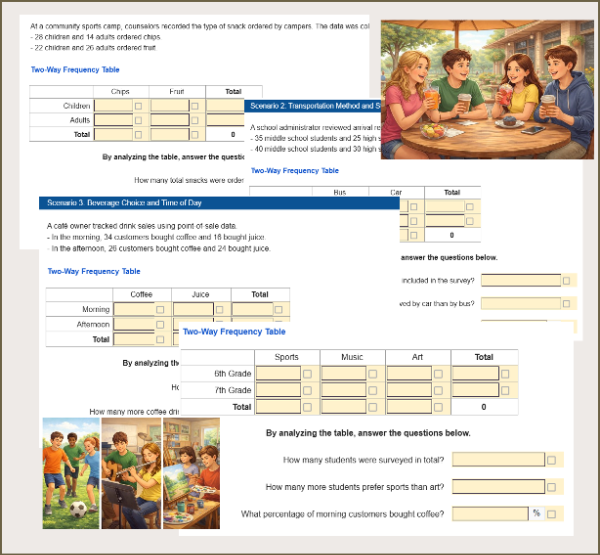
Constructing Two-Way Frequency Tables

Help students explore real-world data using two-way frequency tables. In this interactive worksheet, students calculate relative frequencies, analyze categorical data, and identify possible associations across engaging scenarios like activities, snacks, screen time, and study habits. Aligned to Grade 8 Statistics standards.

Mini LabGrade 8· 20 min

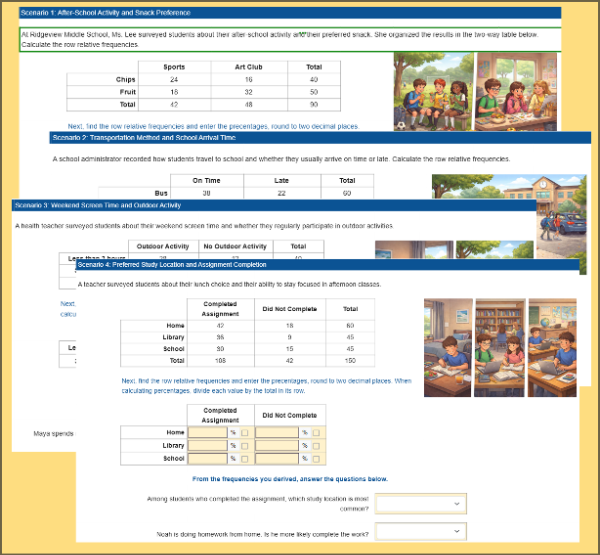
Exploring Association with Two-Way Tables

Students analyze real-world two-way frequency tables to explore possible associations between categorical variables. They calculate and compare relative frequencies, interpret patterns, and justify conclusions using data. Aligned to CCSS 8.SP.A.4, this worksheet builds core statistical reasoning skills and works well for practice, assessment, or independent learning.

Mini LabGrade 8· 20 min

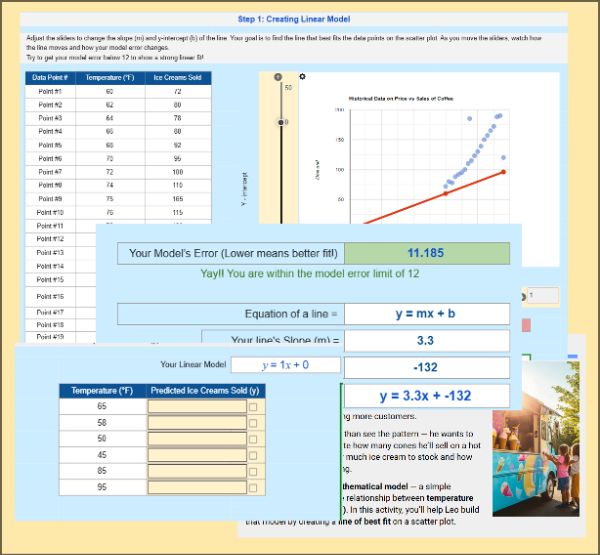
From Pattern to Prediction: Modeling Ice Cream Sales

Students help Leo, an ice cream truck owner, analyze sales data by creating and using a linear model. Using sliders to adjust slope and intercept, they minimize model error, find the best-fit line, and predict sales for new temperatures—discovering how data models are built and used in the real world.

Mini LabGrade 8· 20 min

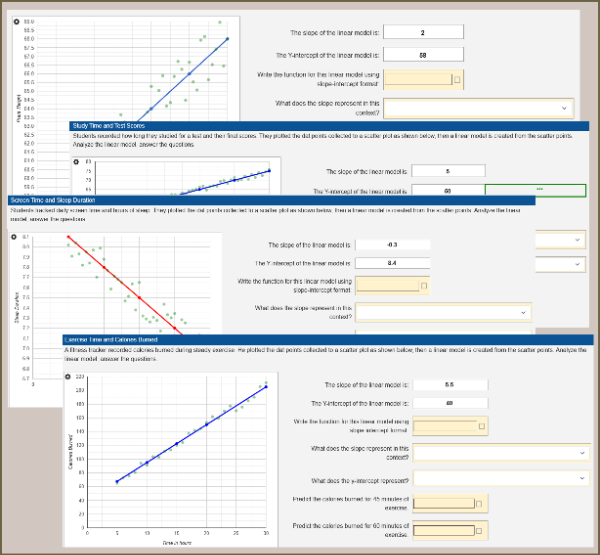
Interpreting Linear Models from Real-World Data

Students analyze real-world scatterplots and linear models to interpret bivariate data. They write equations using given slopes and y-intercepts, explain what these values mean in context, make predictions, and evaluate model limitations. Aligned to CCSS 8.SP.A.3 and ideal for statistics practice or assessment.

Mini LabGrade 8· 20 min

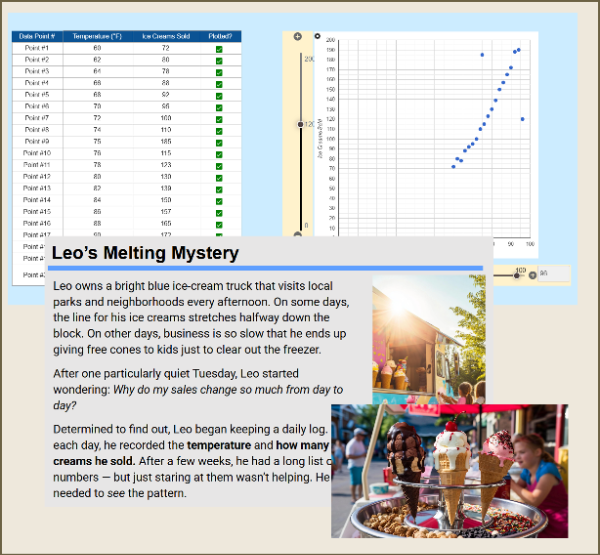
Leo’s Ice Cream Sales: Building a Scatter Plot (Part 1)

Help Leo, an ice cream truck owner, uncover how weather affects his sales! Students plot real data points to create a scatter plot, identify trends, and spot outliers. This engaging, hands-on activity builds understanding of correlation, trend lines, and data interpretation using a fun, real-world scenario.

Mini LabGrade 8· 15 min

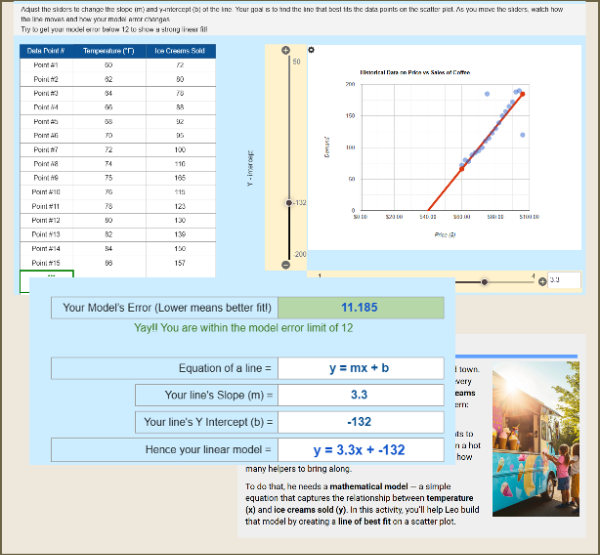
Modeling Ice Cream Sales: Creating Linear Model (Part 2)

Students help Leo, an ice cream truck owner, build a linear model to predict sales! Using interactive sliders to adjust slope and intercept, they create the best-fit line, minimize model error, and discover how straight lines can model real-world data relationships.

Mini LabGrade 8· 20 min

The Lifestyle Data Challenge - Scatter Plot Anlaysis

Help students understand real-world data with this 8th-grade scatter plot activity. Learners compare a data table to three scatter plots, identify associations, clusters, and outliers, and discover why scatter plots make patterns easier to see. A perfect introduction to bivariate data and the 8.SP standards.

Multi-day Labs and Competitions

LabGrade 8· 180 min

Snack Stand: Pricing with Scatter Plots and Linear Models

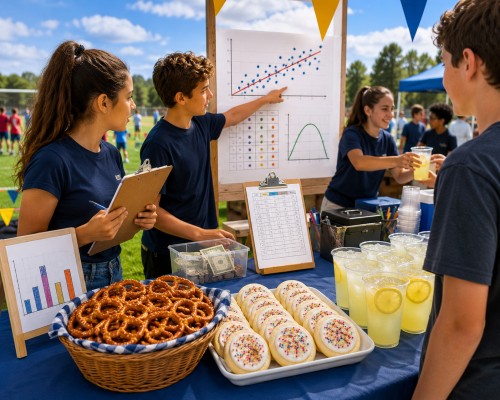
Snack Stand Showdown is a Grade 8 statistics lab where students run a Field Day snack stand and use real data to decide what to charge and how much to buy. They build scatter plots, fit lines of best fit, price from profit curves, place a budgeted vendor order, and read two-way tables. A connected, auto-graded arc covering the full 8.SP standard cluster.

Common Core standards in statistics

Other middle school math topics

Try a statistics activity with your class

Preview any activity for free. A free teacher account lets you assign it, watch students work in real time, and skip the grading.

Create a free teacher account