
The Number System
1
Skill Practice
Irrational Numbers: The Repeating Decimal Lab2
Skill Practice
Locating Irrational Square Roots on a Number Line3
Skill Practice
Rational or Irrational?4
Skill Practice
Converting Fractions and Decimals - Interactive PixelExpressions & Equations
1
Skill Practice
Simplify Using Exponent Rules - Practice Worksheet2
Skill Practice
Square Root Explorer3
Mini Lab
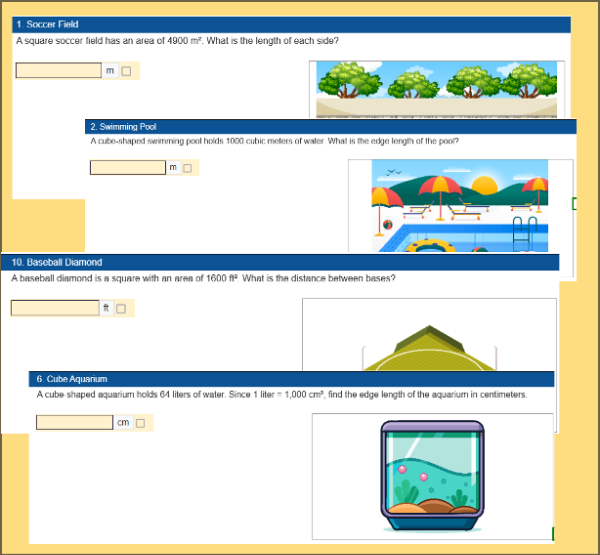
Real-World Problems with Square and Cube RootsHelp students master square roots and cube roots with real-world problems involving areas of squares and volumes of cubes. Learners solve equations like x² = p and x³ = p to find missing dimensions. Supports randomization so each student receives unique problems and answers.
1
Mini Lab
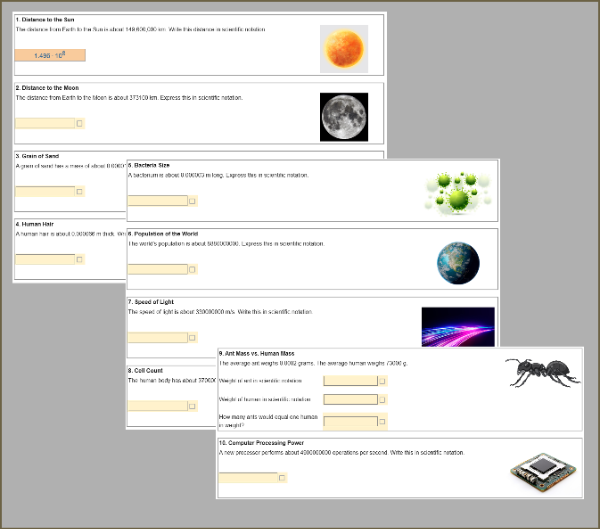
From Atoms to Galaxies: Scientific Notation in ActionExplore real-world measurements from the cosmos to the microscopic world while learning how to write large and small numbers in scientific notation. Students convert quantities into exponential form to make data easier to read, compare, and compute—building confidence with powers of ten and place value understanding.
2
Skill Practice
Space Data Lab: Operations with Scientific Notation3
Mini Lab
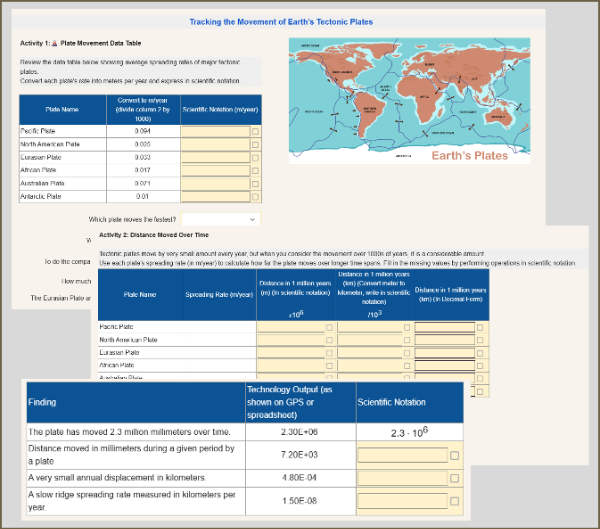
Tracking the Movement of Earth’s Tectonic PlatesExplore how scientists use scientific notation to measure the slow motion of Earth’s tectonic plates. Students convert plate movement data, calculate long-term distances, and interpret technology-generated outputs like E-notation — learning how exponential form makes real-world measurements easier to compare and understand.
4
Mini Lab
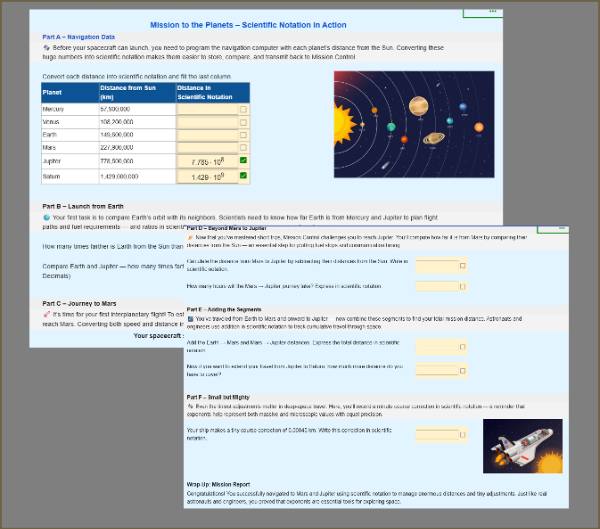
Mission to the Planets – Scientific Notation in ActionBlast off on a math mission through the solar system! In this interactive worksheet, students use scientific notation to calculate and compare planetary distances, travel times, and orbits. A fun, story-driven way to understand why scientists use exponential form to work with extremely large and small numbers.
1
Skill Practice
Interactive Slope Investigation: Finding Δy and Δx2
Skill Practice
Calculating Slope from Two Points on a Graph3
Mini Lab
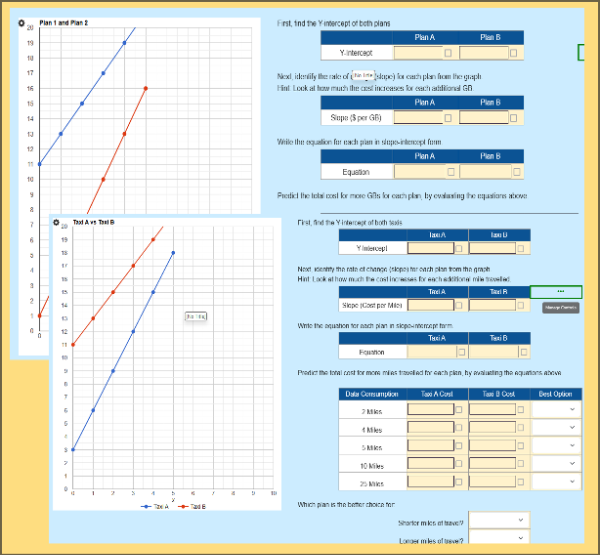
Comparing Linear Models: Which Changes Faster?Students compare real-world linear models by analyzing graphs, identifying slope and y-intercept, writing equations in slope-intercept form, and predicting values. Through an internet plan comparison, learners use equations to determine the better option for low and high usage, building strong conceptual understanding of linear relationships.
4
Mini Lab
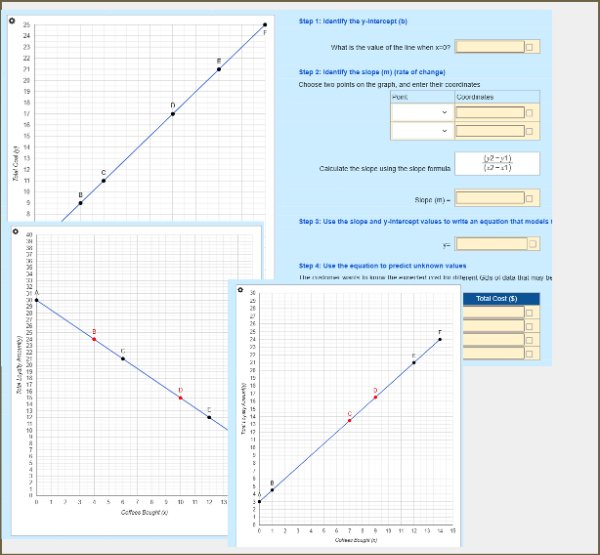
Equation of a Line from Real-World Graphs, Predict UnknownsStudents explore real-world linear relationships by analyzing graphs, identifying slope and y-intercept, and writing equations in slope-intercept form. Using real data from everyday scenarios, they model situations, create equations, and predict unknown values. Ideal for building conceptual understanding of y=mx+b.
5
Mini Lab
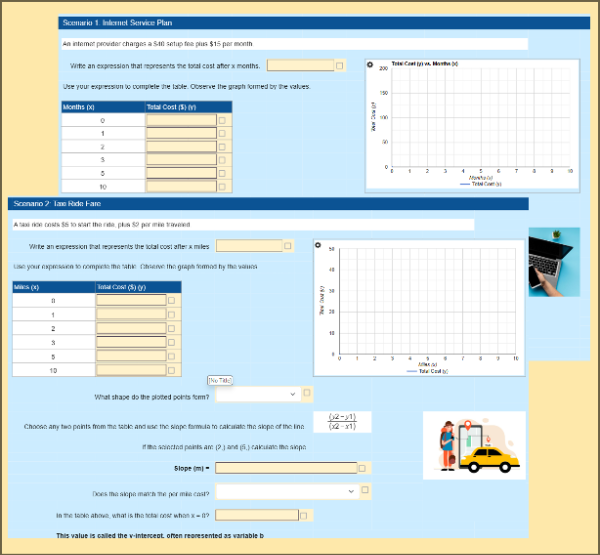
Proportional Relationship & Slope-Intercept FormulaHelp students understand linear relationships through real-world scenarios. In this worksheet, learners write expressions, complete tables, analyze graphs, and identify slope as the unit rate and the y-intercept as the starting value. A strong conceptual bridge leading to the equation y = mx + b.
6
Skill Practice
Proportional Relation– Build the Graph
1
Skill Practice
Linear Equations with Variables on Both Sides2
Skill Practice
Solving One- and Two-Step Linear Equations3
Mini Lab
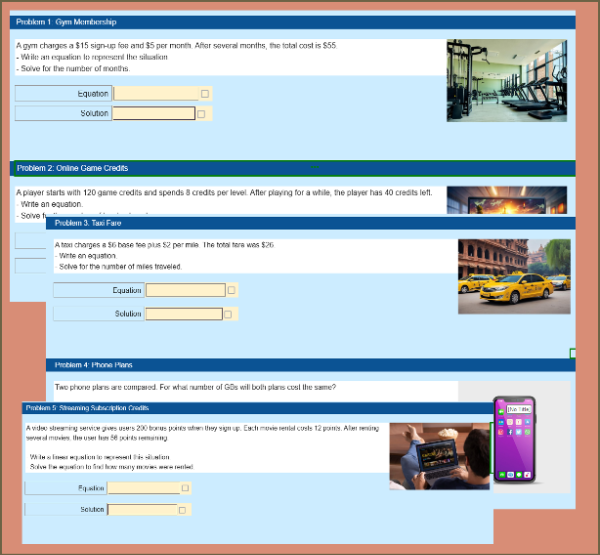
Solving Linear Equations in Real-World SituationsApply algebra to real life with this interactive worksheet on solving linear equations. Students write and solve equations from real-world scenarios, interpret solutions, and identify special cases like no solution or infinite solutions. Supports randomization so every student receives unique problems. Aligned to Grade 8 standard 8.EE.C.7.
1
Skill Practice
Solving Systems of Equations by Graphing2
Skill Practice
Solving Systems of Equations by Substitution3
Skill Practice
Solving Systems of Equations by EliminationFunctions
1
Mini Lab
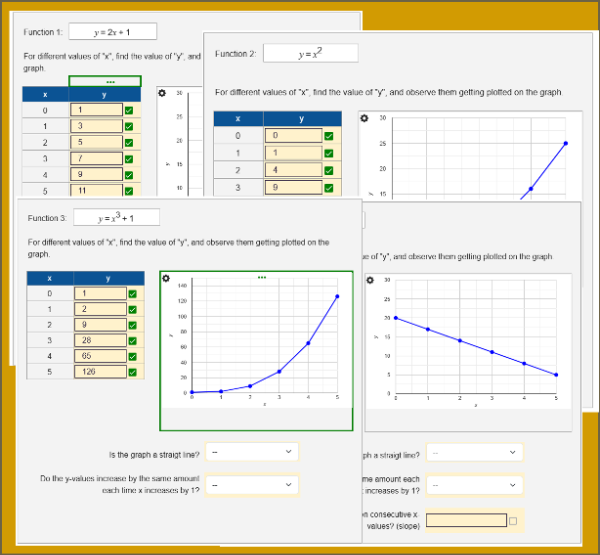
Is It Linear? Discovering Straight-Line FunctionsStudents explore linear and non-linear functions by completing tables, observing graphs, and analyzing equations. They identify straight-line graphs, constant rates of change, and the structure of y=mx+b, then explain why other functions are not linear. Aligned to CCSS 8.F.A.3 and ideal for practice or assessment.
2
Mini Lab
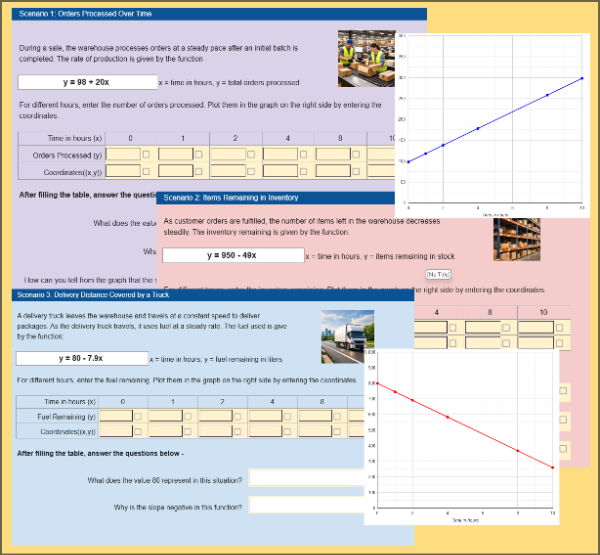
E-Commerce Operations: Graphing Linear FunctionsAnalyze real-world warehouse operations by graphing given linear functions in this interactive worksheet. Students create tables, plot ordered pairs, and interpret slopes and y-intercepts for orders processed, inventory remaining, and fuel usage. Aligned to CCSS 8.F.A.1, this activity builds strong graphing and function interpretation skills through a realistic e-commerce storyline.
3
Mini Lab
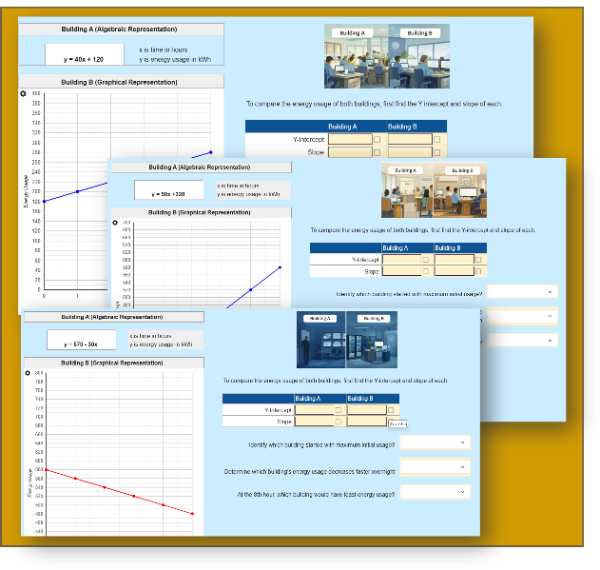
Energy Use: Comparing Algebraic and Graphical RepresentationStudents compare two linear functions represented in algebraic and graphical form to determine which changes faster. Using real-world energy usage scenarios, students identify slopes and y-intercepts, interpret positive and negative rates of change, and justify comparisons. Aligned to CCSS 8.F.A.2 and ideal for practice or assessment.
4
Mini Lab
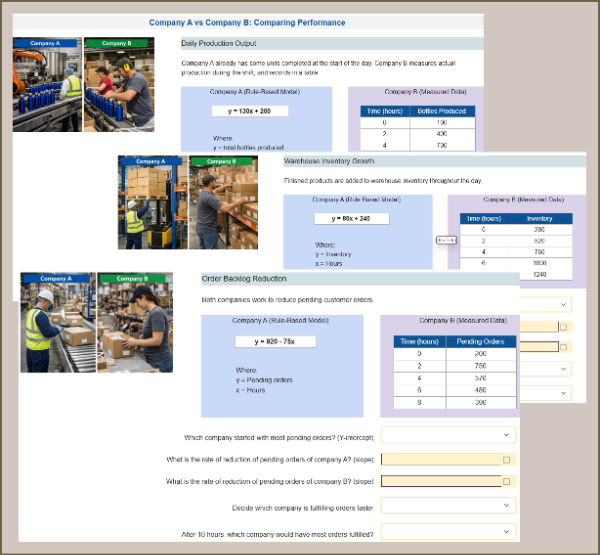
Comparing Delivery Performance: Algebraic & Tabular FunctionsStudents compare two linear functions represented in different forms: one as an algebraic equation and the other as a table of values. Using real-world company operations like production, inventory, and order fulfillment, students identify slopes and intercepts to determine which function changes faster and justify their reasoning.
5
Mini Lab
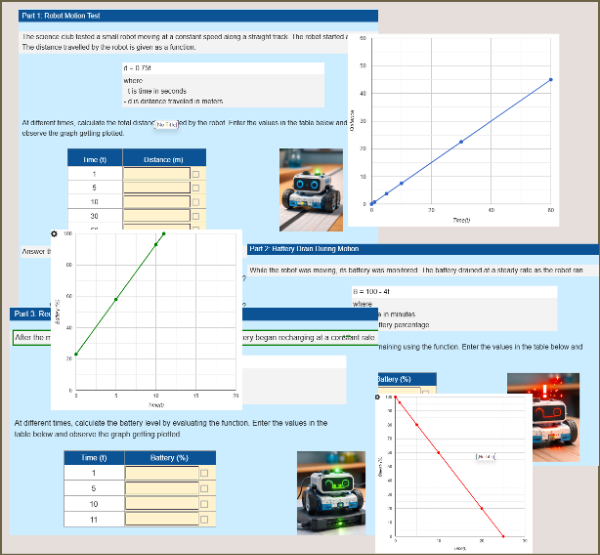
Physics Lab Data: Graphing FunctionsAnalyze real physics experiments using linear functions in this interactive worksheet. Students graph given functions for robot motion, battery drain, and battery charging, then interpret slopes and intercepts in context. Aligned to CCSS 8.F.A.1, this activity builds strong intuition for functions through meaningful graphs and real-world data.
1
Mini Lab
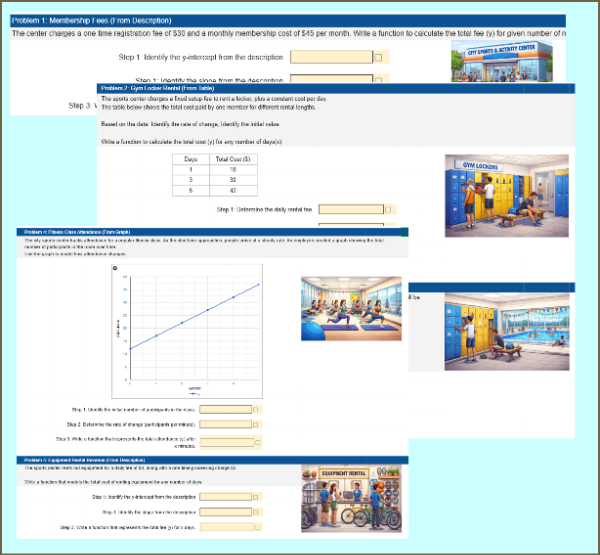
City Sports & Activity Center: Create Functions from Real-World SituationStudents construct linear functions to model real-world situations at a city sports and activity center. Using descriptions, tables, graphs, and data points, they identify rates of change and initial values, write equations in the form y = mx + b, and interpret slope and intercept in context. Aligned to CCSS 8.F.B.4 and ideal for practice or assessment.
Geometry
1
Mini Lab
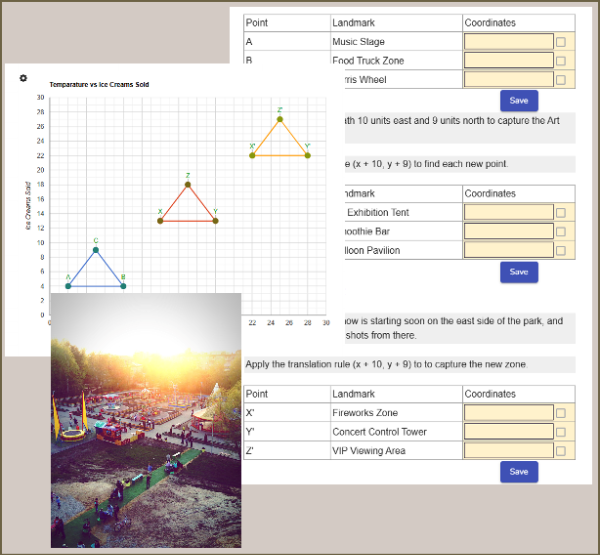
Drone Flight Path Challenge: Discovering TranslationsStudents take control of a drone mapping a city festival to learn how translations work! They plot the drone’s flight path, move it to new coordinates, and verify that the triangles remain congruent after each translation. Through two real-world missions, students discover that translations slide shapes without changing their size, angles, or orientation—making them perfect examples of rigid motion.
2
3
Activity
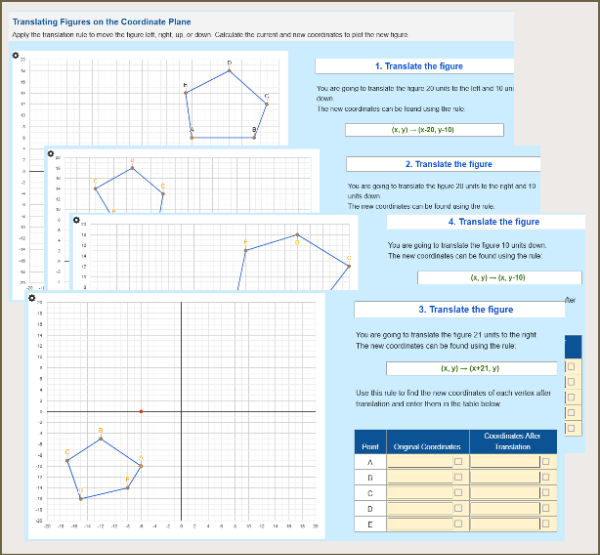
Translating Figures on the Coordinate PlaneHelp students master translations on the coordinate plane with this interactive worksheet. Learners apply translation rules, find new coordinates, and understand how shapes move without changing size or orientation. Supports randomization, giving each student unique figures and translation rules.
4
Mini Lab
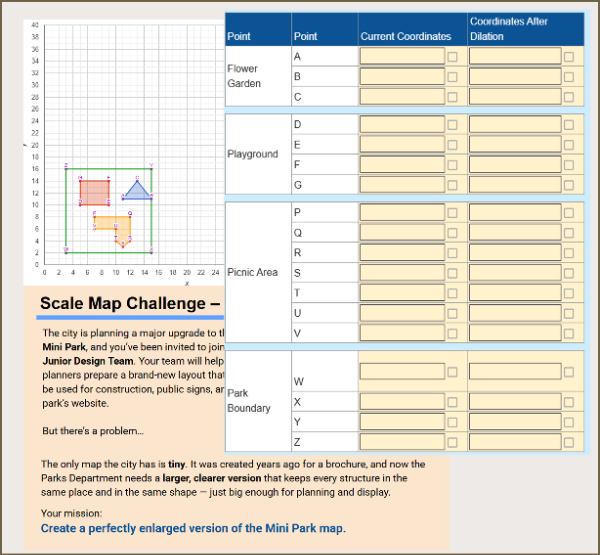
Scaling the Mini Park – Dilation on the Coordinate PlaneDilate a Mini Park on the coordinate plane using a scale factor of 2! Students apply the rule (x, y) → (2x, 2y) to enlarge multiple park structures and watch the scaled map appear as they enter correct coordinates. A hands-on way to explore similarity, scale factors, and dilations in 8th-grade geometry.
1
Skill Practice
Distance Between Points Using Pythagorean Theorem2
Mini Lab
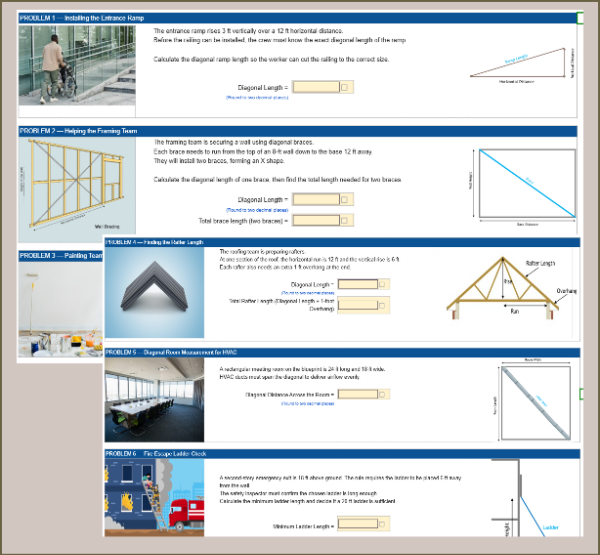
Community Center Construction - Pythagorean MissionHelp students apply the Pythagorean Theorem through real construction problems! From ramps and rafters to ladders and HVAC ducts, learners calculate diagonal distances and solve practical measurement tasks. Real-world visuals and auto-graded inputs make this an engaging 8th-grade geometry activity.
3
Mini Lab
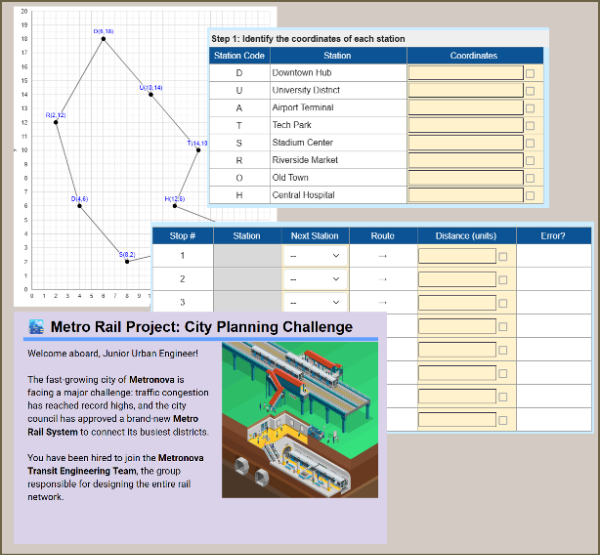
Designing Metronova Metro: Distances on the Coordinate GridDesign a metro rail system by calculating distances between stations using the Pythagorean Theorem. Identify coordinates, build a travel route, estimate total rail length and construction cost, and justify your proposal. With optional randomization, each student receives unique station coordinates.
4
Mini Lab
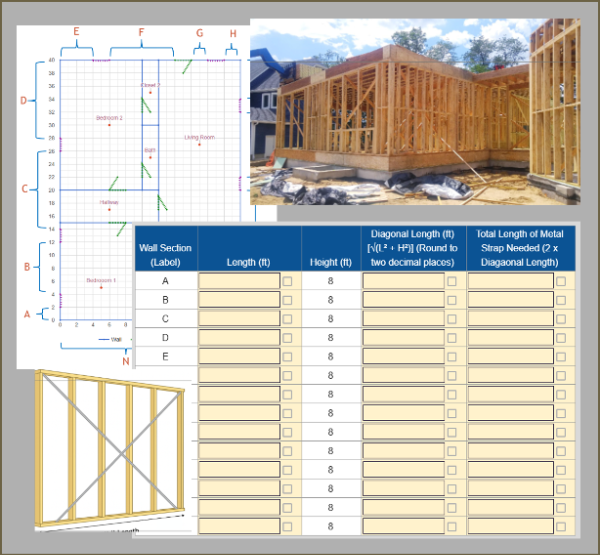
Bracing Estimation: Pythagorean ChallengeEstimate metal strap bracing for a house by analyzing a floor plan and using the Pythagorean Theorem. Students measure exterior wall lengths, calculate diagonal brace lengths, and compute total material needed. A hands-on, real-world construction task that strengthens geometry and problem-solving skills.

1
Mini Lab
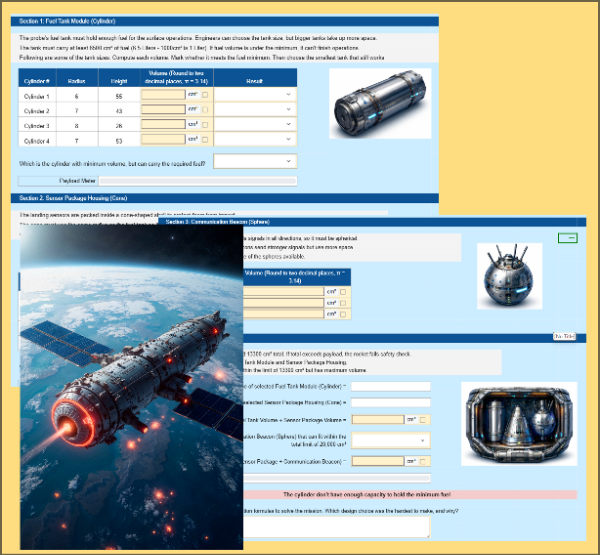
Mission Payload: Volume of ShapesDesign and launch a deep space probe in this interactive real-world math challenge. Students calculate and compare volumes of cylinders, cones, and spheres to meet fuel, sensor, and payload constraints. Using realistic engineering decisions and auto-graded inputs, learners apply 8.G.C.9 concepts while optimizing space and making mission-critical choices.
2
Mini Lab
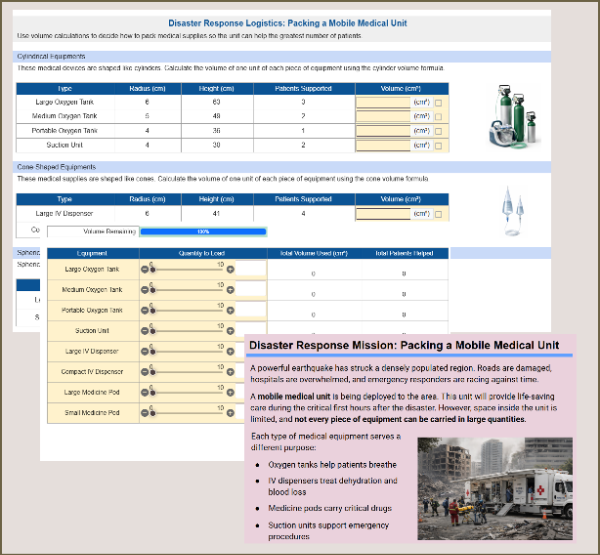
Disaster Response: Packing a Mobile Medical Unit Using Volume CalculationPack a mobile medical unit in this interactive real-world math challenge. Students calculate volumes of cylinders, cones, and spheres, then use sliders to choose equipment quantities that help at least 100 patients while staying within storage limits. A powerful application of CCSS 8.G.C.9 focused on decision making and optimization.
Statistics & Probability
1
Mini Lab
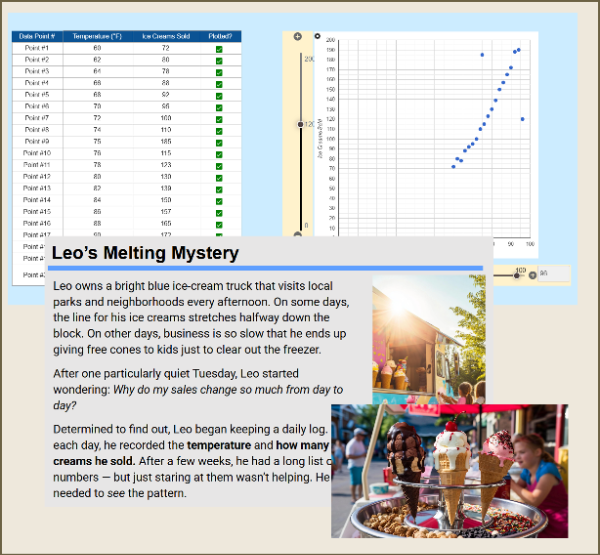
Leo’s Ice Cream Sales: Building a Scatter Plot (Part 1)Help Leo, an ice cream truck owner, uncover how weather affects his sales! Students plot real data points to create a scatter plot, identify trends, and spot outliers. This engaging, hands-on activity builds understanding of correlation, trend lines, and data interpretation using a fun, real-world scenario.
2
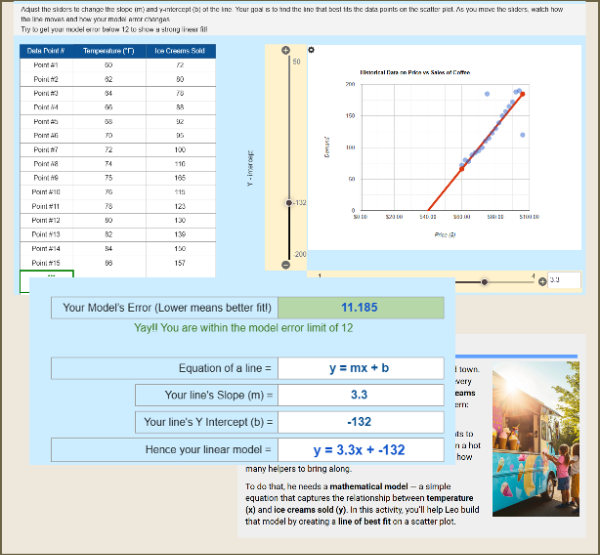
Mini Lab
Modeling Ice Cream Sales: Creating Linear Model (Part 2)Students help Leo, an ice cream truck owner, build a linear model to predict sales! Using interactive sliders to adjust slope and intercept, they create the best-fit line, minimize model error, and discover how straight lines can model real-world data relationships.
3

Mini Lab
The Lifestyle Data Challenge - Scatter Plot AnlaysisHelp students understand real-world data with this 8th-grade scatter plot activity. Learners compare a data table to three scatter plots, identify associations, clusters, and outliers, and discover why scatter plots make patterns easier to see. A perfect introduction to bivariate data and the 8.SP standards.
4
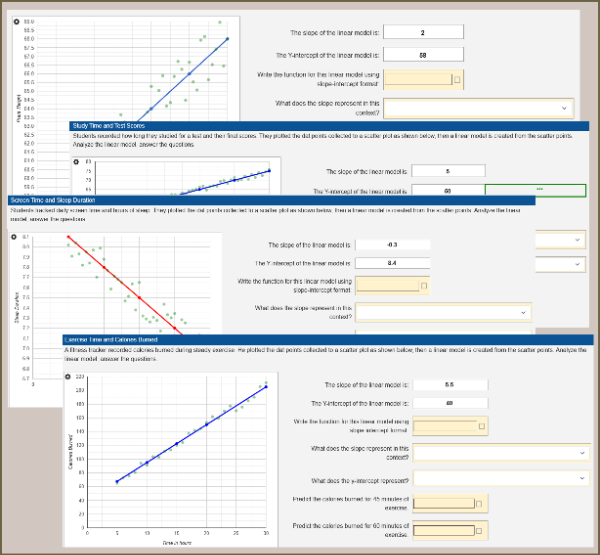
Mini Lab
Interpreting Linear Models from Real-World DataStudents analyze real-world scatterplots and linear models to interpret bivariate data. They write equations using given slopes and y-intercepts, explain what these values mean in context, make predictions, and evaluate model limitations. Aligned to CCSS 8.SP.A.3 and ideal for statistics practice or assessment.
5
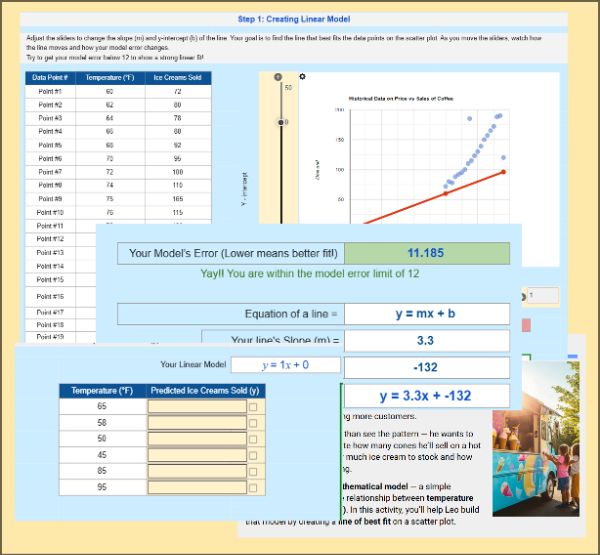
Mini Lab
From Pattern to Prediction: Modeling Ice Cream SalesStudents help Leo, an ice cream truck owner, analyze sales data by creating and using a linear model. Using sliders to adjust slope and intercept, they minimize model error, find the best-fit line, and predict sales for new temperatures—discovering how data models are built and used in the real world.
Seasonal shelf · 1 activity, shown in season
Late NovemberBlack Friday Demand Curve & Profit Maximization20 min
1
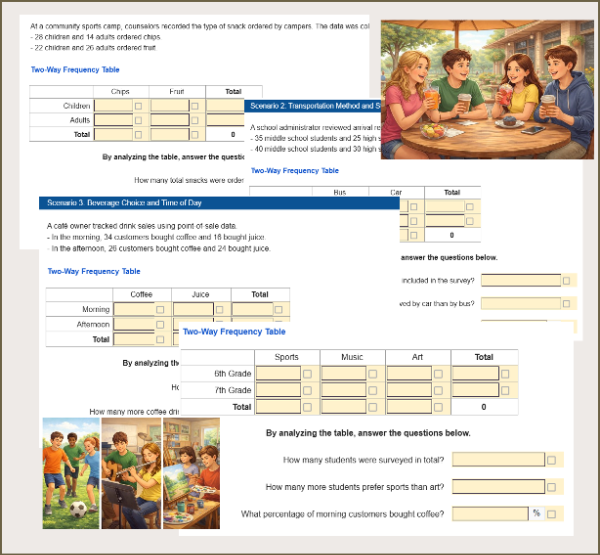
Mini Lab
Constructing Two-Way Frequency TablesHelp students explore real-world data using two-way frequency tables. In this interactive worksheet, students calculate relative frequencies, analyze categorical data, and identify possible associations across engaging scenarios like activities, snacks, screen time, and study habits. Aligned to Grade 8 Statistics standards.
2
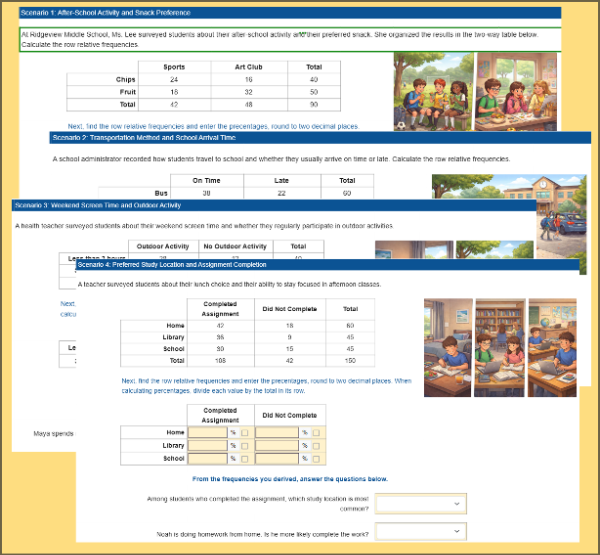
Mini Lab
Exploring Association with Two-Way TablesStudents analyze real-world two-way frequency tables to explore possible associations between categorical variables. They calculate and compare relative frequencies, interpret patterns, and justify conclusions using data. Aligned to CCSS 8.SP.A.4, this worksheet builds core statistical reasoning skills and works well for practice, assessment, or independent learning.
Seasonal, Other
Seasonal shelf · 2 activities, shown in season
SeasonalBack to School: Fundraiser Goal Tracker10 min
Seasonal7th Grade in 10 Questions15 min