Skill PracticeGrades 7, 8· 20 min
Mean Absolute Deviation Practice
Practice calculating the Mean Absolute Deviation (MAD) of a data set step-by-step—starting from the mean, to absolute deviations, and finally to the MAD value.

8th grade · Statistics & Probability
Construct and interpret scatter plots for bivariate measurement data to investigate patterns of association between two quantities. Describe patterns such as clustering, outliers, positive or negative association, linear association, and nonlinear association.
5 interactive, auto-graded activities for 8th grade students practising 8.SP.A.1. Mini Labs put the standard to work in a real scenario; Skill Practice builds fluency on the standard alone. Every one is randomized per student, so each learner gets their own numbers.
Practice calculating the Mean Absolute Deviation (MAD) of a data set step-by-step—starting from the mean, to absolute deviations, and finally to the MAD value.
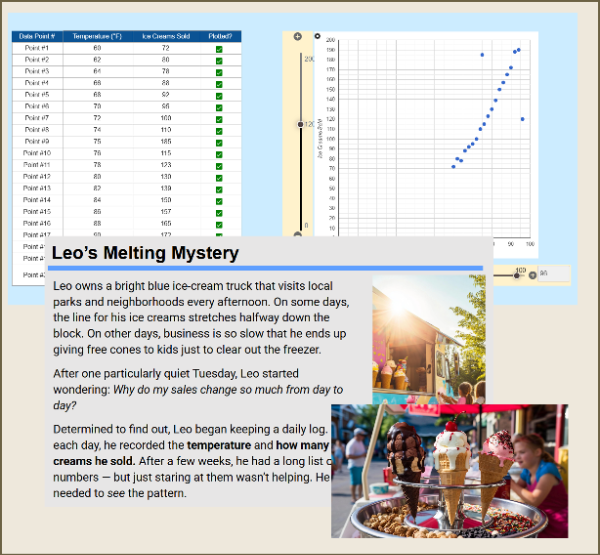
Help Leo, an ice cream truck owner, uncover how weather affects his sales! Students plot real data points to create a scatter plot, identify trends, and spot outliers. This engaging, hands-on activity builds understanding of correlation, trend lines, and data interpretation using a fun, real-world scenario.
Help students understand real-world data with this 8th-grade scatter plot activity. Learners compare a data table to three scatter plots, identify associations, clusters, and outliers, and discover why scatter plots make patterns easier to see. A perfect introduction to bivariate data and the 8.SP standards.
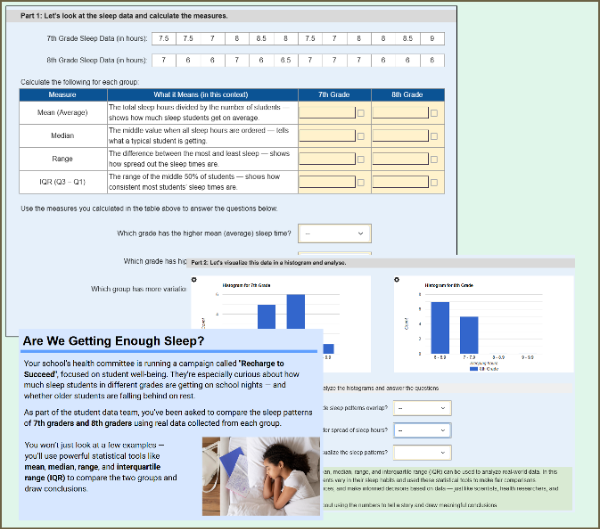
Students compare the sleep patterns of 7th and 8th graders using real-world data. They calculate mean, median, range, and IQR, then interpret histograms and make informal inferences about group differences. This worksheet supports randomization, so each student may receive different sleep data.
Labs run 2 to 4 class periods and connect several standards into one project.
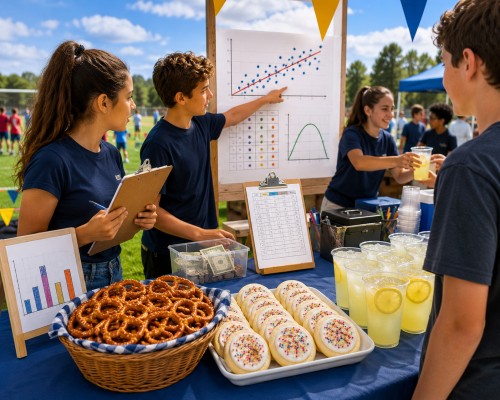
Snack Stand Showdown is a Grade 8 statistics lab where students run a Field Day snack stand and use real data to decide what to charge and how much to buy. They build scatter plots, fit lines of best fit, price from profit curves, place a budgeted vendor order, and read two-way tables. A connected, auto-graded arc covering the full 8.SP standard cluster.
Preview any activity for free. Create a free teacher account to assign it to your class, see every student's work live, and get results auto-graded.