8th grade · Statistics & Probability

8.SP.A.3 worksheets and activities

Use the equation of a linear model to solve problems in the context of bivariate measurement data, interpreting the slope and intercept. *For example, in a linear model for a biology experiment, interpret a slope of 1.5 cm/hr as meaning that an additional hour of sunlight each day is associated with an additional 1.5 cm in mature plant height*.

4 interactive, auto-graded activities for 8th grade students practising 8.SP.A.3. Mini Labs put the standard to work in a real scenario; Skill Practice builds fluency on the standard alone. Every one is randomized per student, so each learner gets their own numbers.

8.SP.A.3 worksheets: Mini Labs and Skill Practice

Mini LabGrade 8· 20 min

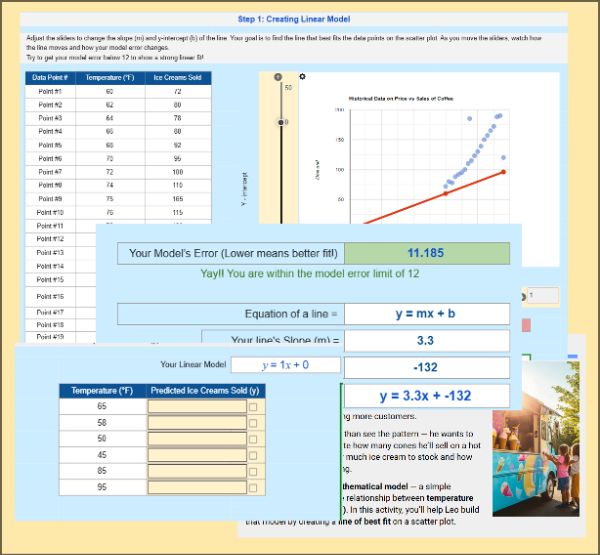
From Pattern to Prediction: Modeling Ice Cream Sales

Students help Leo, an ice cream truck owner, analyze sales data by creating and using a linear model. Using sliders to adjust slope and intercept, they minimize model error, find the best-fit line, and predict sales for new temperatures—discovering how data models are built and used in the real world.
Mini LabGrade 8· 20 min

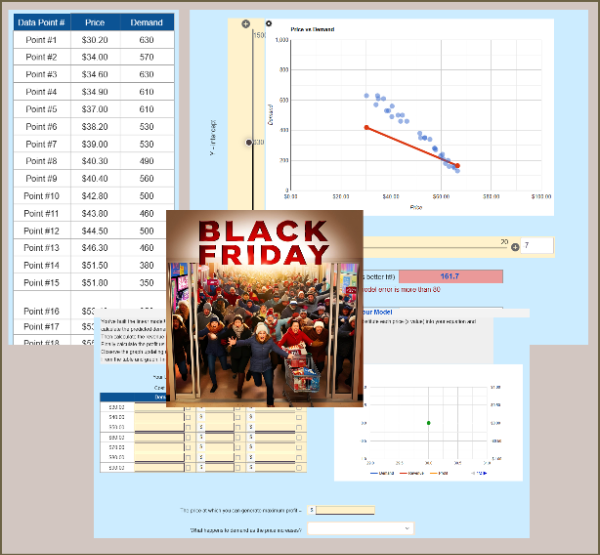
Black Friday Demand Curve & Profit Maximization

Students build a linear model from a price–demand scatterplot, then use it to predict demand, revenue, and profit at different price points. They analyze curves and determine the price that maximizes profit. A perfect real-world 8th-grade activity for scatterplots, linear modeling, and financial reasoning.

Mini LabGrade 8· 20 min

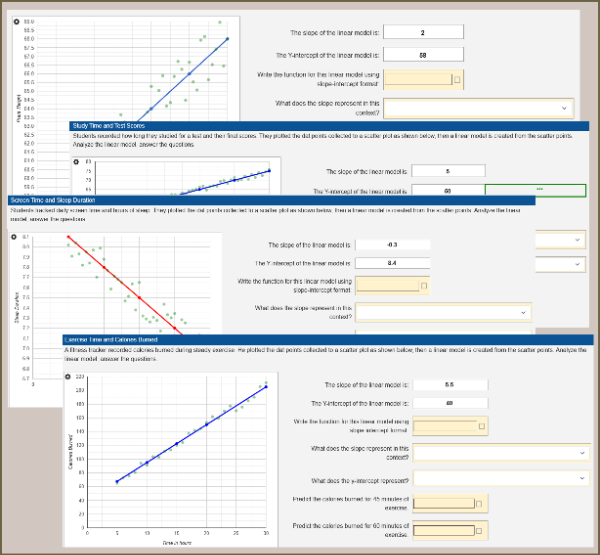
Interpreting Linear Models from Real-World Data

Students analyze real-world scatterplots and linear models to interpret bivariate data. They write equations using given slopes and y-intercepts, explain what these values mean in context, make predictions, and evaluate model limitations. Aligned to CCSS 8.SP.A.3 and ideal for statistics practice or assessment.

Multi-day Labs that cover 8.SP.A.3

Labs run 2 to 4 class periods and connect several standards into one project.

LabGrade 8· 180 min

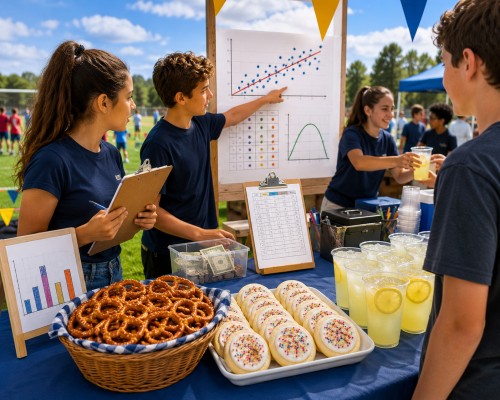
Snack Stand: Pricing with Scatter Plots and Linear Models

Snack Stand Showdown is a Grade 8 statistics lab where students run a Field Day snack stand and use real data to decide what to charge and how much to buy. They build scatter plots, fit lines of best fit, price from profit curves, place a budgeted vendor order, and read two-way tables. A connected, auto-graded arc covering the full 8.SP standard cluster.

Other 8th grade Statistics & Probability standards

Assign a 8.SP.A.3 activity in minutes

Preview any activity for free. Create a free teacher account to assign it to your class, see every student's work live, and get results auto-graded.