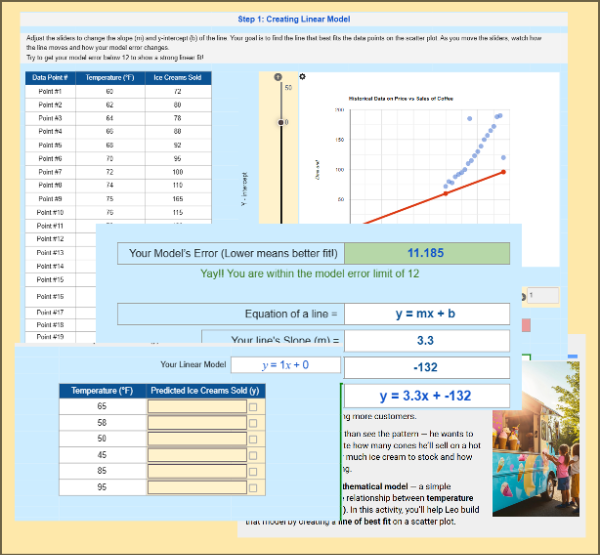
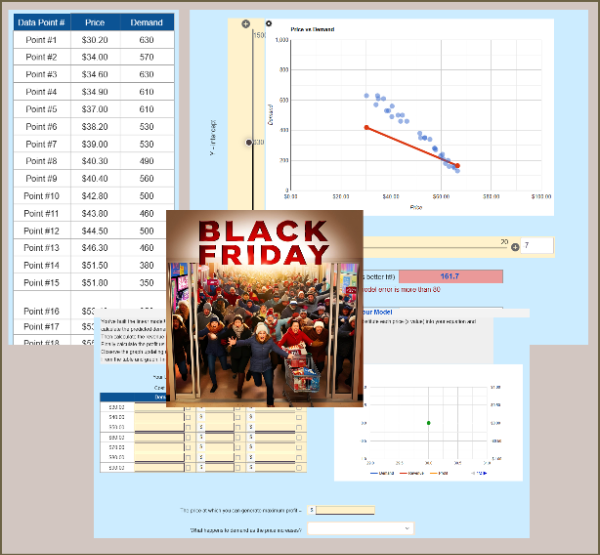
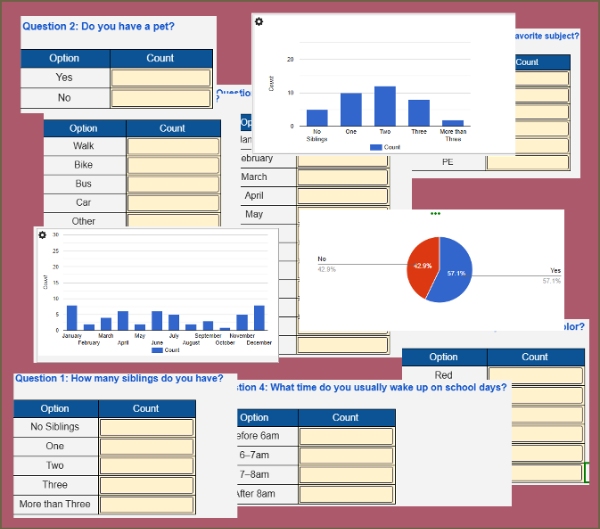
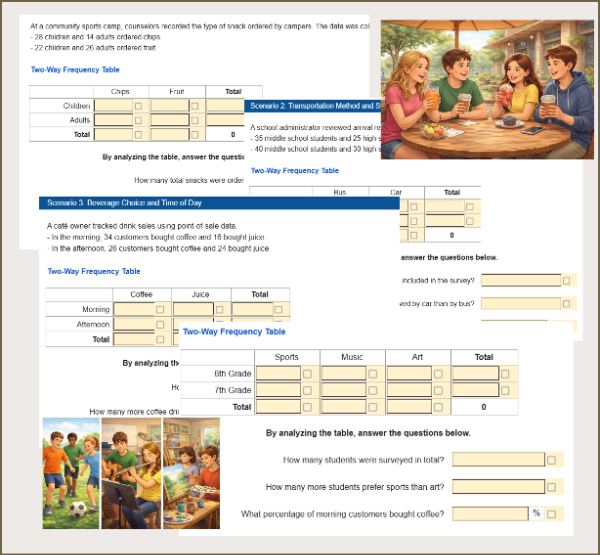
Help students make the critical transition from algebraic skills to statistical reasoning with this interactive worksheet on interpreting linear models from real-world data. Students analyze scatterplots with lines of best fit, write linear equations, interpret slope and y-intercept in context, and use models to make predictions while understanding their limitations.
This activity is ideal for building conceptual understanding of bivariate data and linear models, not just calculating equations.
What Students Will Learn
Students will:
- Analyze scatterplots showing real-world data
- Use a given linear model to represent trends
- Write equations in slope-intercept form
- Interpret the slope as a rate of change in context
- Interpret the y-intercept as an initial or baseline value
- Make predictions using linear models
Real-World Contexts Included
All scenarios use meaningful, relatable data:
- 🌱 Plant Growth and Sunlight (Biology)
- 📚 Study Time and Test Scores (Education)
- 📱 Screen Time and Sleep Duration (Wellness)
- 🏃 Exercise Time and Calories Burned (Health)
Each context includes:
- A scatterplot of measured data
- A line of best fit already drawn
- A provided slope and y-intercept
- Guided interpretation and prediction questions
- Skills & Standards Alignment
Common Core Standard:
✔ CCSS 8.SP.A.3 — Use linear models to solve problems involving bivariate measurement data and interpret slope and intercept.
Students practice:
- Statistical interpretation
- Modeling with real data
- Reading and using graphs
- Making predictions responsibly
- Explaining mathematical meaning in words
Why Teachers Love This Worksheet
- Clear distinction between functions and statistics
- Emphasis on interpretation, not just computation
- Strong real-world relevance
- Supports randomization for differentiated instruction
- Works perfectly with auto-grading platforms
- Ideal for classwork, homework, assessments, or review
- Encourages mathematical reasoning and explanation
This worksheet helps students understand how linear models are used to describe trends in real data, preparing them for deeper work in statistics, algebra, and data analysis.
Students will use linear models to interpret real-world bivariate data by analyzing a given equation, identifying and explaining the slope and y-intercept, and using the model to make predictions. Students will also evaluate the reasonableness and limitations of linear models in context.
Aligned to CCSS: 8.SP.A.3
This worksheet supports randomization, meaning each student may receive different slopes and y-intercepts while practicing the same interpretation skills. This encourages independent reasoning and reduces copying.
💡 Tip: When assigning this activity to your classroom, you can optionally enable randomization to give each student a unique version of the problems. When you re-assign the same worksheet, each student will get a new set of questions, helping them master the content through repeated practice.