Understand that patterns of association can also be seen in bivariate categorical data by displaying frequencies and relative frequencies in a two-way table. Construct and interpret a two-way table summarizing data on two categorical variables collected from the same subjects. Use relative frequencies calculated for rows or columns to describe possible association between the two variables. *For example, collect data from students in your class on whether or not they have a curfew on school nights and whether or not they have assigned chores at home. Is there evidence that those who have a curfew also tend to have chores?*
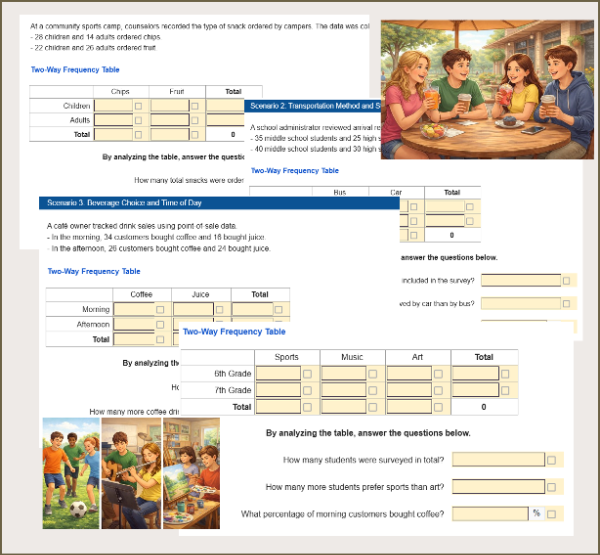
3 interactive, auto-graded activities for 8th grade students practising 8.SP.A.4. Mini Labs put the standard to work in a real scenario; Skill Practice builds fluency on the standard alone. Every one is randomized per student, so each learner gets their own numbers.
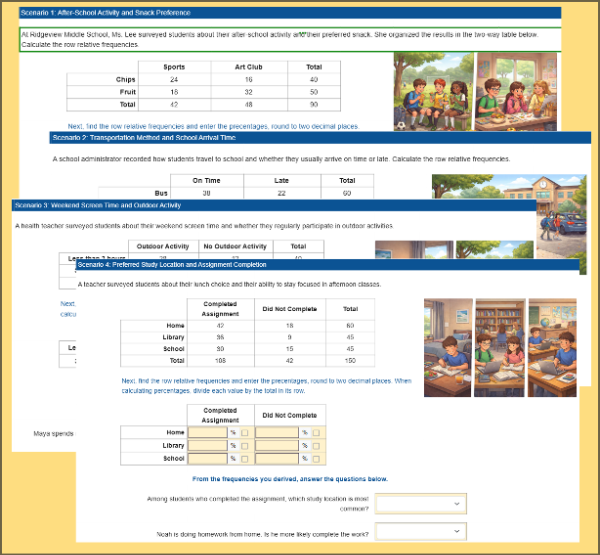
Students analyze real-world two-way frequency tables to explore possible associations between categorical variables. They calculate and compare relative frequencies, interpret patterns, and justify conclusions using data. Aligned to CCSS 8.SP.A.4, this worksheet builds core statistical reasoning skills and works well for practice, assessment, or independent learning.
Help students explore real-world data using two-way frequency tables. In this interactive worksheet, students calculate relative frequencies, analyze categorical data, and identify possible associations across engaging scenarios like activities, snacks, screen time, and study habits. Aligned to Grade 8 Statistics standards.
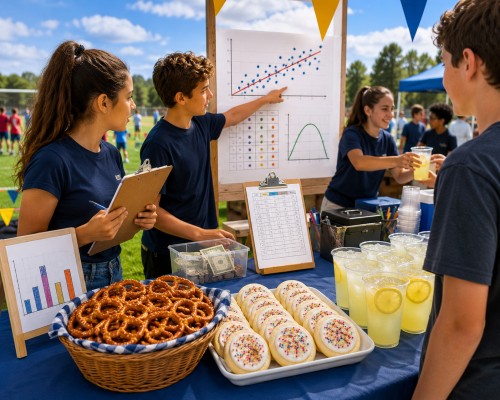
Snack Stand Showdown is a Grade 8 statistics lab where students run a Field Day snack stand and use real data to decide what to charge and how much to buy. They build scatter plots, fit lines of best fit, price from profit curves, place a budgeted vendor order, and read two-way tables. A connected, auto-graded arc covering the full 8.SP standard cluster.