Snack Stand: Pricing with Scatter Plots and Linear Models

Snack Stand Showdown is a Grade 8 statistics lab where students run a Field Day snack stand and use real data to decide what to charge and how much to buy. They build scatter plots, fit lines of best fit, price from profit curves, place a budgeted vendor order, and read two-way tables. A connected, auto-graded arc covering the full 8.SP standard cluster.

Snack Stand Showdown: An 8th Grade Statistics Lab Where Math Makes the Money


Turn the 8.SP standards into a story your students will not forget. In Snack Stand Showdown, students take charge of a Field Day snack stand selling three products and face two real business questions: what price should we charge, and how many should we buy? Every answer comes from statistics, not guesswork. Students build models from years of past sales data, use those models to set prices, place a real order against a budget, and then watch the event play out to see whether their math paid off.


This is not a worksheet packet. It is a connected, multi-day lab where each activity feeds the next. The scatter plot a student builds becomes the line they fit, the line becomes the profit curve they price from, the price drives the order they place, and the order decides their final profit. Decisions carry consequences all the way to a final settle-up against a $600 profit target.


What students do


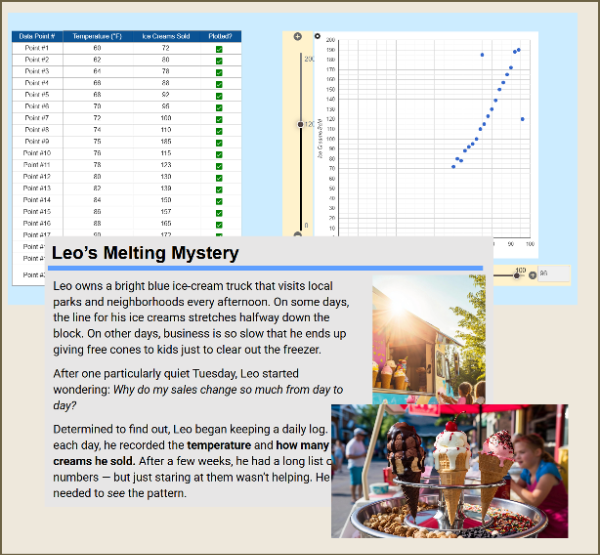
  • Plot real past-sales data as scatter plots and describe the direction, strength, and outliers in each
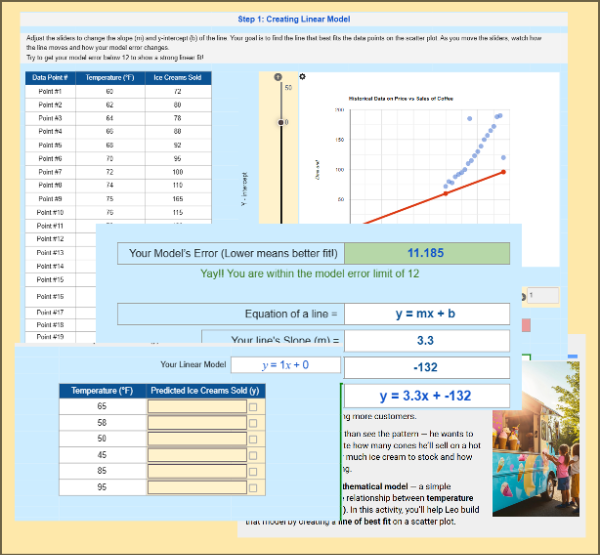
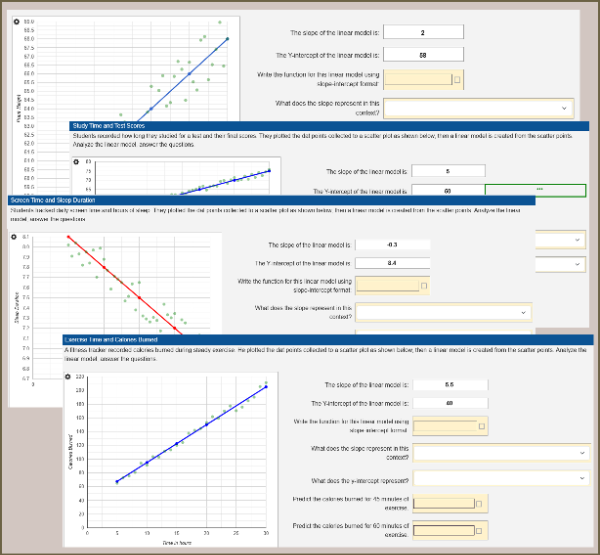
  • Fit a line of best fit using interactive sliders, then write the linear model in y = mx + b form
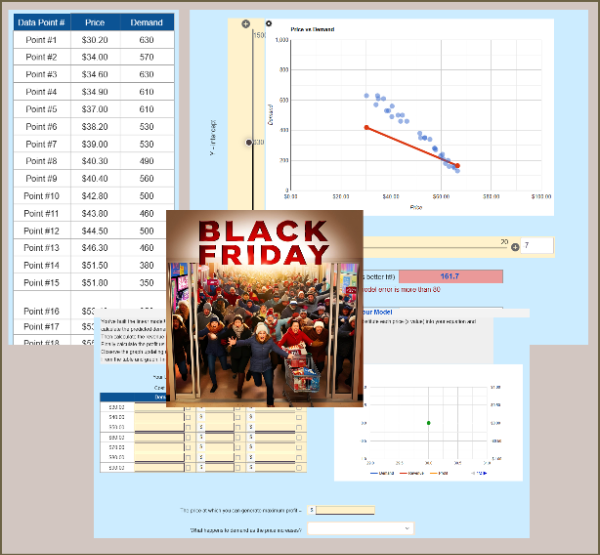
  • See their own linear model power a profit curve and read the best price off its peak
  • Place one combined vendor order within a budget, weighing buyback risk and model quality
  • Interpret hour-by-hour sales results, comparing what their model predicted against what actually happened
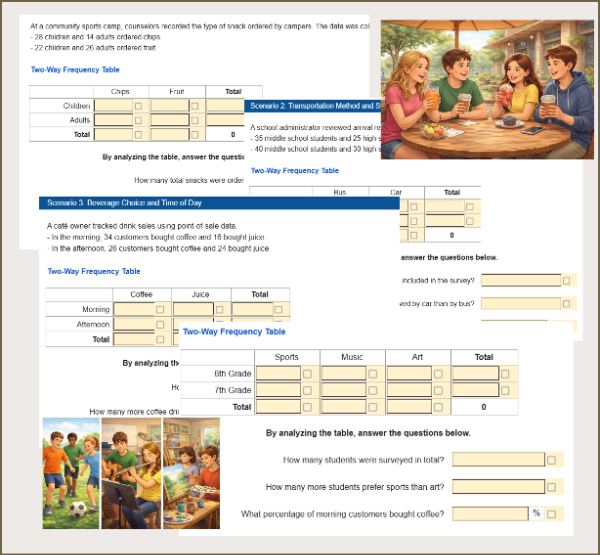
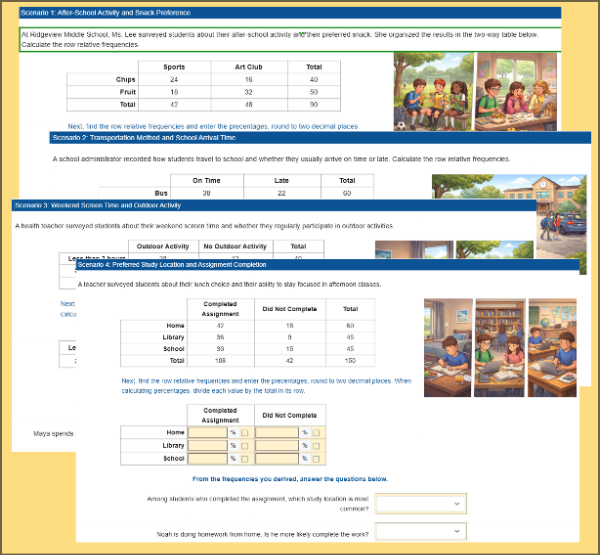
  • Complete and analyze a two-way table to test whether grade level is associated with snack choice


Standards covered

  • 8.SP.A.1 Construct and interpret scatter plots, describing association and outliers
  • 8.SP.A.2 Fit a straight line to data and assess how well it fits
  • 8.SP.A.3 Use the slope and intercept of a linear model to solve problems
  • 8.SP.A.4 Build two-way tables and use relative frequencies to investigate association
  • Reinforces 7.RP.A and 7.NS.A through proportional reasoning and decimal arithmetic in the budgeting and ordering steps


Why teachers use it

  • Fully interactive and auto-graded, with a real-time dashboard showing who started, who finished, and who is stuck
  • A built-in lesson on data literacy: students learn that a model predicts but does not promise, and that a loose fit leads to mispricing and leftover loss
  • Three products designed to teach three different lessons: one clean dataset, one with an outlier to exclude, and one with a weak association
  • No prep required. Each activity includes a learning objective, student instructions, and a teacher tip
  • Built for real class time, with seven to ten minutes of genuine mathematical work per activity and no filler


Best for: 8th grade math, Algebra readiness, statistics units, real-world math projects, end-of-unit application, and STEM enrichment. Aligned to Common Core and ready to assign.

Snack Stand: Pricing with Scatter Plots and Linear Models preview
Preview
Grade level
8
Type
Lab
Duration
180 minutes
Auto-graded
Yes
Topics
StatisticsComparing PopulationsScatter PlotsTrend LinesBivariate Data AnalysisInterpreting DataTwo-Way Tables
Tags
Real World

Related grade 8 activities

More interactive, auto-graded activities on the same standards and topics.

Mini LabGrade 8· 20 min

From Pattern to Prediction: Modeling Ice Cream Sales

Students help Leo, an ice cream truck owner, analyze sales data by creating and using a linear model. Using sliders to adjust slope and intercept, they minimize model error, find the best-fit line, and predict sales for new temperatures—discovering how data models are built and used in the real world.

Mini LabGrade 8· 20 min

Leo’s Ice Cream Sales: Building a Scatter Plot (Part 1)

Help Leo, an ice cream truck owner, uncover how weather affects his sales! Students plot real data points to create a scatter plot, identify trends, and spot outliers. This engaging, hands-on activity builds understanding of correlation, trend lines, and data interpretation using a fun, real-world scenario.

Mini LabMiddle School· 20 min

Black Friday Demand Curve & Profit Maximization

Students build a linear model from a price–demand scatterplot, then use it to predict demand, revenue, and profit at different price points. They analyze curves and determine the price that maximizes profit. A perfect real-world 8th-grade activity for scatterplots, linear modeling, and financial reasoning.

Mini LabGrade 8· 20 min

Constructing Two-Way Frequency Tables

Help students explore real-world data using two-way frequency tables. In this interactive worksheet, students calculate relative frequencies, analyze categorical data, and identify possible associations across engaging scenarios like activities, snacks, screen time, and study habits. Aligned to Grade 8 Statistics standards.

Mini LabGrade 8· 20 min

Exploring Association with Two-Way Tables

Students analyze real-world two-way frequency tables to explore possible associations between categorical variables. They calculate and compare relative frequencies, interpret patterns, and justify conclusions using data. Aligned to CCSS 8.SP.A.4, this worksheet builds core statistical reasoning skills and works well for practice, assessment, or independent learning.

Mini LabGrade 8· 20 min

Interpreting Linear Models from Real-World Data

Students analyze real-world scatterplots and linear models to interpret bivariate data. They write equations using given slopes and y-intercepts, explain what these values mean in context, make predictions, and evaluate model limitations. Aligned to CCSS 8.SP.A.3 and ideal for statistics practice or assessment.