Exploring Association with Two-Way Tables

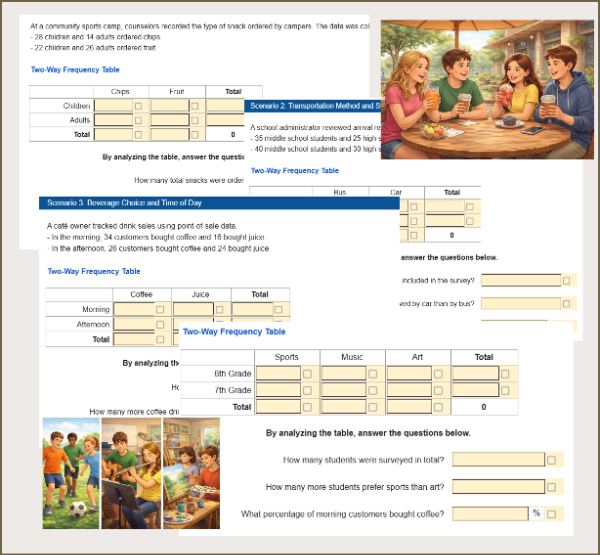
Students analyze real-world two-way frequency tables to explore possible associations between categorical variables. They calculate and compare relative frequencies, interpret patterns, and justify conclusions using data. Aligned to CCSS 8.SP.A.4, this worksheet builds core statistical reasoning skills and works well for practice, assessment, or independent learning.

Interpreting Two-Way Frequency Tables | Grade 8 Statistics (CCSS 8.SP.A.4)


This interactive worksheet helps students analyze two-way frequency tables to identify possible associations between categorical variables. Using realistic, student-friendly scenarios, learners calculate row relative frequencies, compare percentages, and draw evidence-based conclusions without confusing association with causation.


Students work through multiple real-world contexts, making this activity ideal for conceptual understanding, assessment, or independent practice in middle school statistics.


What Students Will Do

  • Read and interpret two-way frequency tables
  • Calculate row relative frequencies and percentages
  • Compare groups using data, not assumptions
  • Identify possible associations between categorical variables
  • Explain conclusions using appropriate statistical language


Included Real-World Scenarios

  • After-school activity and snack preference
  • Transportation method and school arrival time
  • Weekend screen time and outdoor activity
  • Preferred study location and assignment completion


Each scenario includes guided questions, multiple-choice prompts, and written justification to strengthen reasoning skills.


Why Teachers Love This Worksheet

  • Fully aligned to CCSS 8.SP.A.4
  • Emphasizes association, not causation
  • Clear, consistent structure across all scenarios
  • Supports randomization, so each student can receive a different data table
  • Works well for classwork, homework, quizzes, or test prep
  • Easy to auto-grade with built-in checks


This worksheet builds essential statistical literacy and prepares students for state assessments by focusing on interpretation, reasoning, and real-world data analysis.

Learning Objective

Students will analyze two-way frequency tables to calculate and interpret relative frequencies, identify possible associations between two categorical variables, and justify conclusions using evidence from the data.

Randomization Available

This worksheet supports randomization, so each student receives a different two-way table while practicing the same skills. This promotes independent thinking and prevents copying.

💡 Tip: When assigning this activity to your classroom, you can optionally enable randomization to give each student a unique version of the problems. When you re-assign the same worksheet, each student will get a new set of questions, helping them master the content through repeated practice.

Exploring Association with Two-Way Tables preview
Preview
Grade level
8
Type
Mini Lab (real-world worksheet)
Duration
20 minutes
Auto-graded
Yes
Randomized per student
Yes
Common Core standards
8.SP.A.4
Topics
StatisticsComparing PopulationsBivariate Data AnalysisInterpreting Data
Tags
Real WorldData AnalysisPractice Worksheet

Related grade 8 activities

More interactive, auto-graded activities on the same standards and topics.

LabGrade 8· 180 min

Snack Stand: Pricing with Scatter Plots and Linear Models

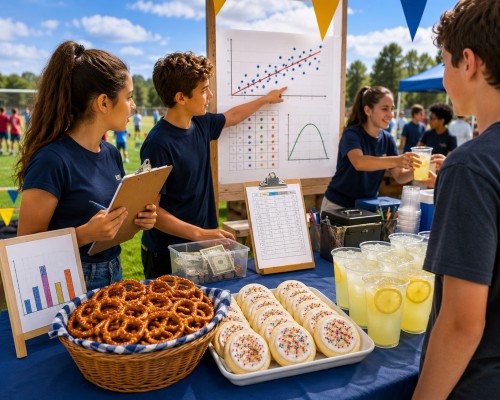
Snack Stand Showdown is a Grade 8 statistics lab where students run a Field Day snack stand and use real data to decide what to charge and how much to buy. They build scatter plots, fit lines of best fit, price from profit curves, place a budgeted vendor order, and read two-way tables. A connected, auto-graded arc covering the full 8.SP standard cluster.

Mini LabGrade 8· 20 min

Constructing Two-Way Frequency Tables

Help students explore real-world data using two-way frequency tables. In this interactive worksheet, students calculate relative frequencies, analyze categorical data, and identify possible associations across engaging scenarios like activities, snacks, screen time, and study habits. Aligned to Grade 8 Statistics standards.

Skill PracticeGrades 6, 7, 8· 20 min

Back to School: Know Your Classroom

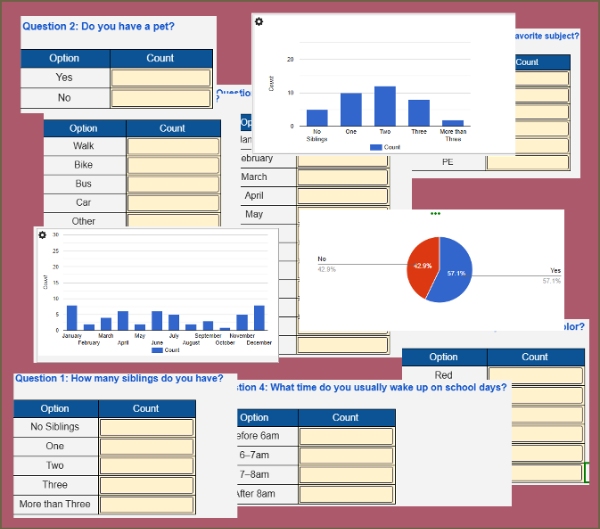
Students collect and summarize data from a live classroom survey on topics like pets, siblings, and school routines. As they enter values, interactive charts update in real time. Students then analyze the graphs and answer summary questions. A fun way to learn data collection and interpretation!

Mini LabGrade 8· 20 min

Black Friday Demand Curve & Profit Maximization

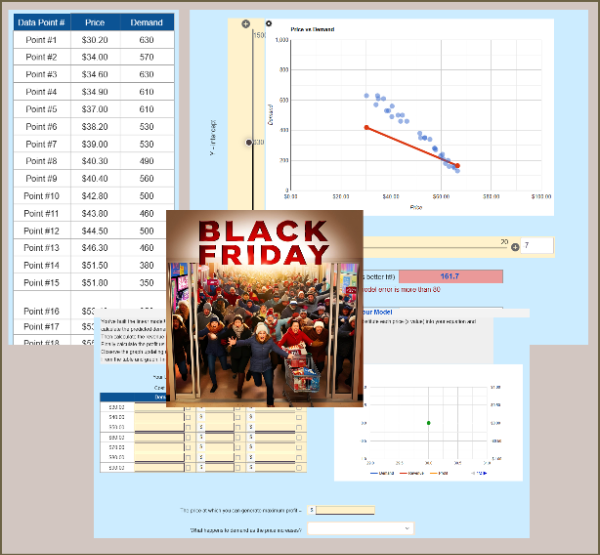
Students build a linear model from a price–demand scatterplot, then use it to predict demand, revenue, and profit at different price points. They analyze curves and determine the price that maximizes profit. A perfect real-world 8th-grade activity for scatterplots, linear modeling, and financial reasoning.

Mini LabGrade 8· 20 min

From Pattern to Prediction: Modeling Ice Cream Sales

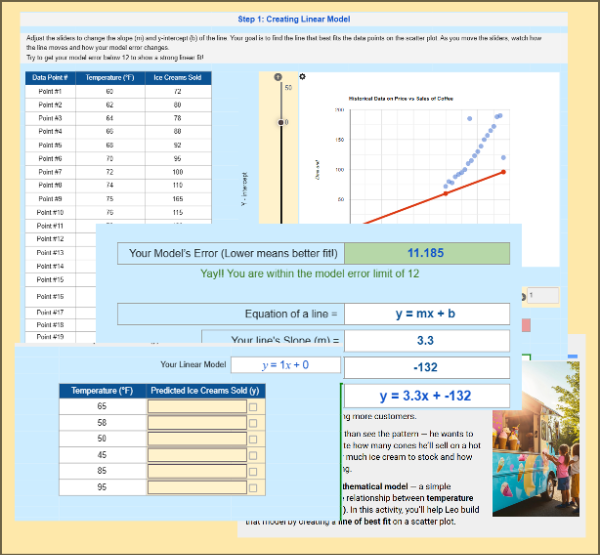
Students help Leo, an ice cream truck owner, analyze sales data by creating and using a linear model. Using sliders to adjust slope and intercept, they minimize model error, find the best-fit line, and predict sales for new temperatures—discovering how data models are built and used in the real world.