Understand that statistics can be used to gain information about a population by examining a sample of the population; generalizations about a population from a sample are valid only if the sample is representative of that population. Understand that random sampling tends to produce representative samples and support valid inferences.
4 interactive, auto-graded activities for 7th grade students practising 7.SP.A.1. Mini Labs put the standard to work in a real scenario; Skill Practice builds fluency on the standard alone. Every one is randomized per student, so each learner gets their own numbers.
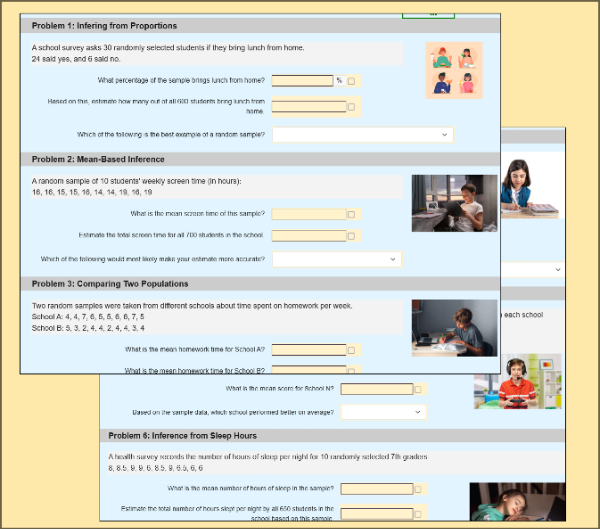
In this worksheet, students analyze six real-world scenarios involving random samples to make inferences about larger populations. They will calculate proportions, means, and ranges, and reflect on the reliability of their conclusions based on sample size and variability.
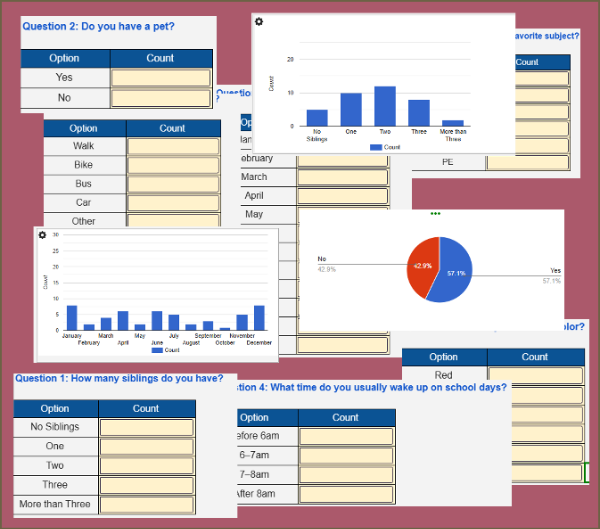
Students collect and summarize data from a live classroom survey on topics like pets, siblings, and school routines. As they enter values, interactive charts update in real time. Students then analyze the graphs and answer summary questions. A fun way to learn data collection and interpretation!
Students will analyze four types of graphs: a scatter plot, a histogram, a bar chart, and a line chart. Their task is to interpret the data presented in each graph and answer specific questions related to the information.
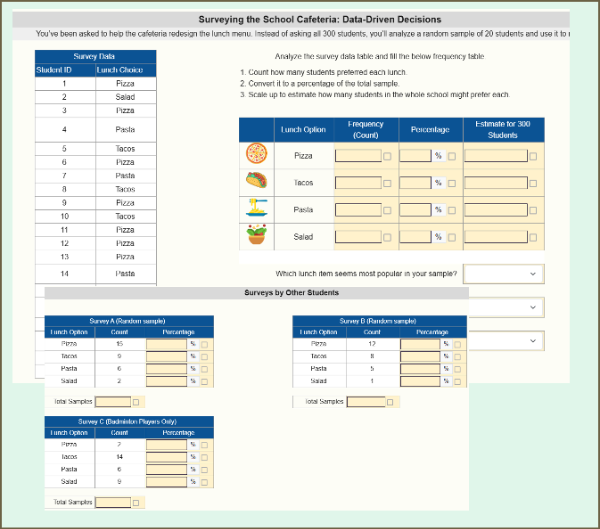
Students analyze a random sample of lunch preferences to estimate the most popular food choices in their school. They compare results from multiple surveys—including a biased one—to understand the importance of sample size and randomness in drawing reliable conclusions.