Understand that the probability of a chance event is a number between 0 and 1 that expresses the likelihood of the event occurring. Larger numbers indicate greater likelihood. A probability near 0 indicates an unlikely event, a probability around 1/2 indicates an event that is neither unlikely nor likely, and a probability near 1 indicates a likely event.
4 interactive, auto-graded activities for 7th grade students practising 7.SP.C.5. Mini Labs put the standard to work in a real scenario; Skill Practice builds fluency on the standard alone. Every one is randomized per student, so each learner gets their own numbers.
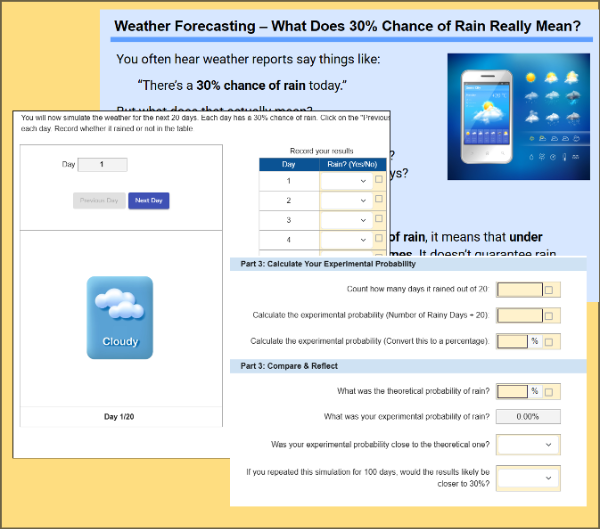
Students explore how theoretical probability applies to real-world weather forecasting by simulating 20 days of rain predictions. They compare their experimental results to the predicted 30% chance of rain and reflect on what probability really means.
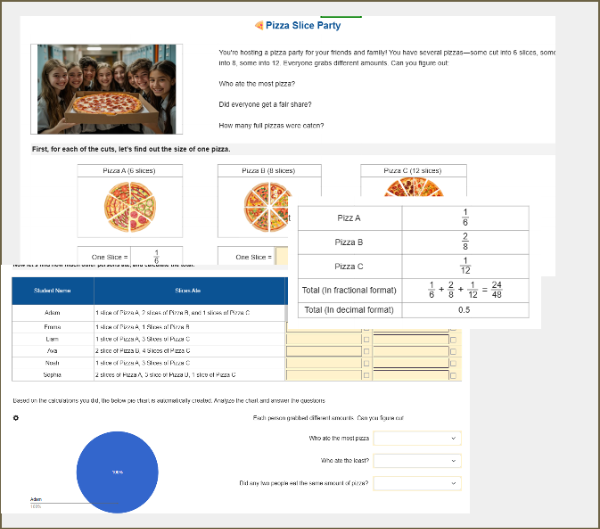
A fun and visual worksheet where students calculate how much pizza each person ate using fractions and decimals. Perfect for practicing proportional reasoning, comparisons, and data interpretation with minimal text and maximum engagement.
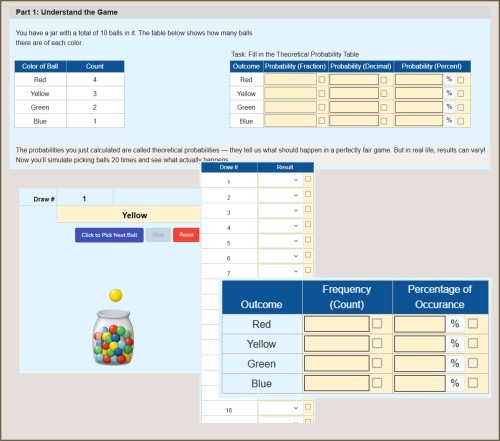
Explore probability through a fun ball-drawing simulation! Students calculate theoretical probabilities, simulate 20 draws from a colored ball jar, record outcomes, and compare results to expected values. A hands-on activity that builds intuition around chance, fairness, and real-world variability.
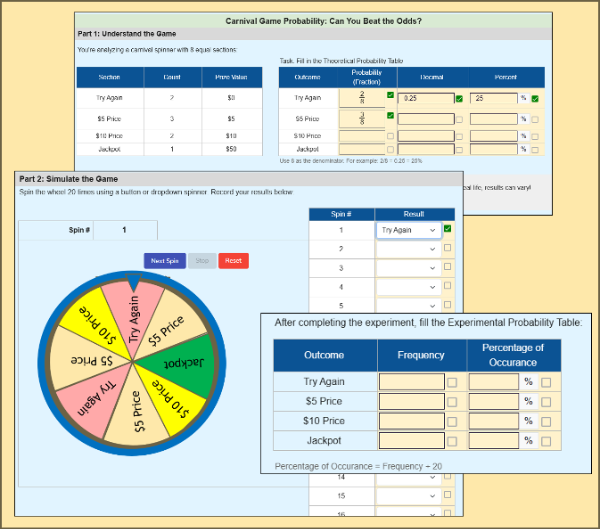
Students explore probability through a carnival spinner game. They calculate theoretical probabilities, run a 20-spin simulation, and compare theoretical and experimental probabilities.
This worksheet supports randomization — each student gets unique outcomes on every spin.