Approximate the probability of a chance event by collecting data on the chance process that produces it and observing its long-run relative frequency, and predict the approximate relative frequency given the probability. *For example, when rolling a number cube 600 times, predict that a 3 or 6 would be rolled roughly 200 times, but probably not exactly 200 times*.
3 interactive, auto-graded activities for 7th grade students practising 7.SP.C.6. Mini Labs put the standard to work in a real scenario; Skill Practice builds fluency on the standard alone. Every one is randomized per student, so each learner gets their own numbers.
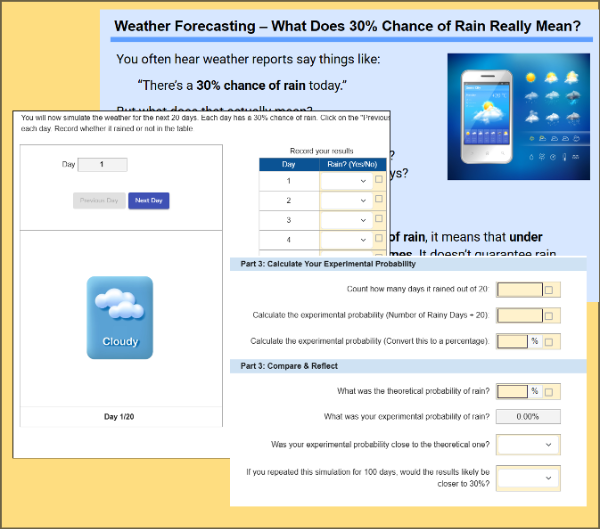
Students explore how theoretical probability applies to real-world weather forecasting by simulating 20 days of rain predictions. They compare their experimental results to the predicted 30% chance of rain and reflect on what probability really means.
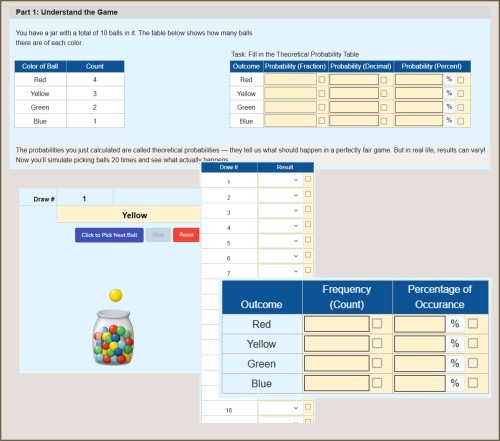
Explore probability through a fun ball-drawing simulation! Students calculate theoretical probabilities, simulate 20 draws from a colored ball jar, record outcomes, and compare results to expected values. A hands-on activity that builds intuition around chance, fairness, and real-world variability.
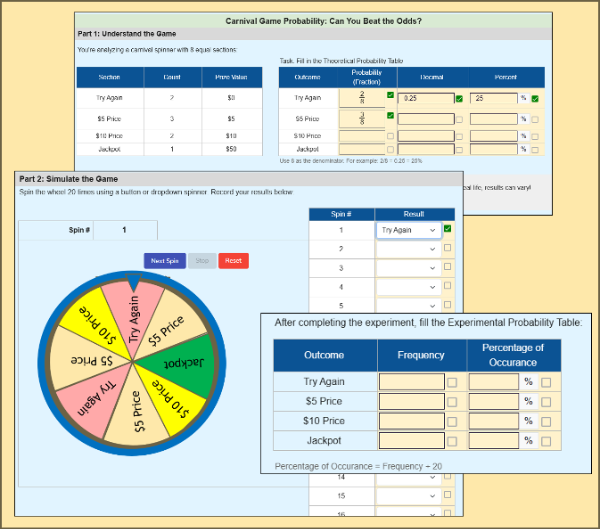
Students explore probability through a carnival spinner game. They calculate theoretical probabilities, run a 20-spin simulation, and compare theoretical and experimental probabilities.
This worksheet supports randomization — each student gets unique outcomes on every spin.