Pizza Slice Party: Fractions & Decimals

A fun and visual worksheet where students calculate how much pizza each person ate using fractions and decimals. Perfect for practicing proportional reasoning, comparisons, and data interpretation with minimal text and maximum engagement.

🍕 Pizza Slice Party – Fractions, Decimals & Data Interpretation Worksheet (7th Grade)


Make math deliciously engaging with this real-world pizza-themed worksheet! In this interactive activity, students calculate how much pizza each person ate by converting slices into fractions and decimals. With different pizzas cut into 6, 8, and 12 slices, students practice fraction addition, decimal conversion, and proportional reasoning in a fun, low-text format.


They’ll:

  • Convert slices eaten into fractional and decimal values
  • Compare total pizza eaten by each person
  • Interpret a pie chart showing everyone’s share
  • Answer reasoning questions based on their calculations


📘 Concepts Covered:

  • Fractions of a whole
  • Decimal equivalents
  • Comparing quantities
  • Pie chart interpretation
  • Real-world proportional reasoning


📊 Features:

  • Highly visual, minimal reading
  • Auto-graded with support for randomization
  • Ideal for classwork, homework, or math centers
  • Boosts student engagement with a relatable context


Learning Objective

Students will apply knowledge of fractions, decimals, and proportional reasoning to calculate and compare how much pizza each person ate. They will also analyze visual data using a pie chart and practice converting between fractions and decimals in a real-world context.

Pizza Slice Party: Fractions & Decimals preview
Preview
Grade level
7
Type
Mini Lab (real-world worksheet)
Duration
15 minutes
Auto-graded
Yes
Topics
Numbers & OperationsRatios & ProportionsRatioProportional RelationshipsOperations with Rational NumbersNegative Numbers
Tags
Real WorldPractice WorksheetConceptual UnderstandingBell Ringer

Related grade 7 activities

More interactive, auto-graded activities on the same standards and topics.

LabGrades 6, 7· 120 min

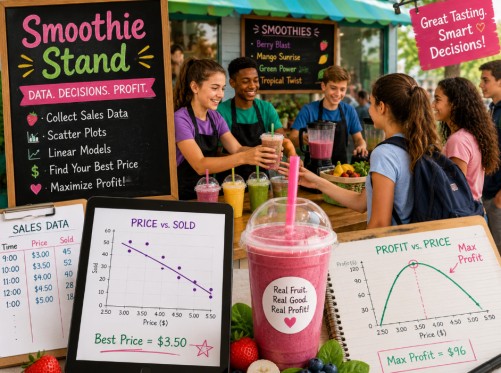
Smoothie Fractions: Run the Bar

Students run a smoothie bar for a day, and every decision is a fraction problem with a real purpose. Six connected, auto-graded interactive worksheets covering multiply, divide, equivalent fractions, compare, and order. Carry-forward story keeps math meaningful. Common Core aligned. Run it in a day or across two weeks.

Mini LabGrade 7· 20 min

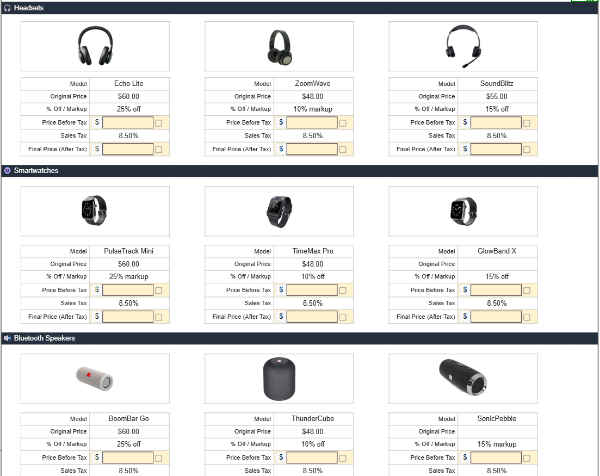
Simple Interest: Saving for your dream house

Students will use the simple interest formula and its variations to find the interest, principal to be deposited, and the interest rate they should be looking for to get $100,000 after 10 years for their dream house.

Mini LabGrade 7· 20 min

Simple Interest: Saving for your dream house

Students will use the simple interest formula and its variations to find the interest, principal to be deposited, and the interest rate they should be looking for to get $100,000 after 10 years for their dream house.

CompetitionGrades 7, 8· 120 min

Car Manufacturing: Number Challenge

Students apply ratios, percentages, and budgeting skills in this fast-paced, team-based math competition. As co-founders of a vehicle startup, they calculate production costs, analyze sales offers, and race through 10 business cycles—boosting engagement through real-world math, strategy, and collaboration.

LabGrade 7· 120 min

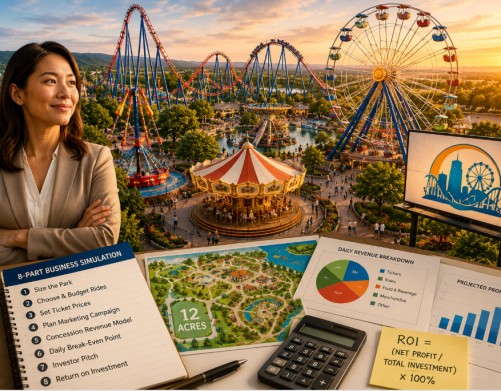
Theme Park Tycoon - A Ratios & Proportions Lab

Theme Park Tycoon is an 8-part Grade 7 ratios and proportions project where students design Aurora Park for an investor. Every worksheet's numbers carry forward, so their choices on rides, pricing, and budget flow into a final ROI they defend. Auto-graded, interactive, and 7.RP-aligned. Real proportional reasoning with real stakes.