"What Can You Infer?" – Making Predictions from Random Samples

In this worksheet, students analyze six real-world scenarios involving random samples to make inferences about larger populations. They will calculate proportions, means, and ranges, and reflect on the reliability of their conclusions based on sample size and variability.

This interactive 7th grade statistics worksheet helps students develop a deep understanding of how to make inferences from random samples—a critical concept in data literacy. Through six thoughtfully designed real-world scenarios, students will calculate proportions, means, and ranges from small sample datasets, then use those results to make predictions about larger populations.


Scenarios include

  • estimating how many students bring lunch from home
  • analyzing average sleep hours
  • comparing homework time across two schools
  • evaluating how results change when a second sample is added, etc.

Students are also introduced to the idea of evaluating the confidence level of their inferences based on factors such as sample size, variation, and sampling method.


A final reflection activity asks students to review all six scenarios and complete a summary table, reinforcing the importance of choosing the right metric and evaluating the reliability of conclusions.


This worksheet aligns with Common Core standards 7.SP.1 and 7.SP.2, making it an excellent resource for practicing key statistics concepts while also building real-world reasoning and data interpretation skills.

Learning Objective

Students will analyze data from random samples and use statistical measures such as mean, median, range, and proportion to make inferences about larger populations. They will evaluate the reliability of their conclusions based on sample size, variability, and sampling methods.

Randomization Available

If randomization is enabled, each student will receive different sample data values, leading to unique calculations for proportions, means, and totals. This ensures individualized responses and prevents copying while maintaining consistent question structure.

💡 Tip: When assigning this activity to your classroom, you can optionally enable randomization to give each student a unique version of the problems. When you re-assign the same worksheet, each student will get a new set of questions, helping them master the content through repeated practice.

"What Can You Infer?" – Making Predictions from Random Samples preview
Preview
Grade level
7
Type
Mini Lab (real-world worksheet)
Duration
20 minutes
Auto-graded
Yes
Randomized per student
Yes
Common Core standards
7.SP.A.17.SP.A.2
Topics
StatisticsRandom SamplesComparing PopulationsInterpreting Data
Tags
Real WorldConceptual UnderstandingDrill & PracticeBell RingerExit Ticket

Related grade 7 activities

More interactive, auto-graded activities on the same standards and topics.

Skill PracticeGrades 6, 7, 8· 20 min

Back to School: Know Your Classroom

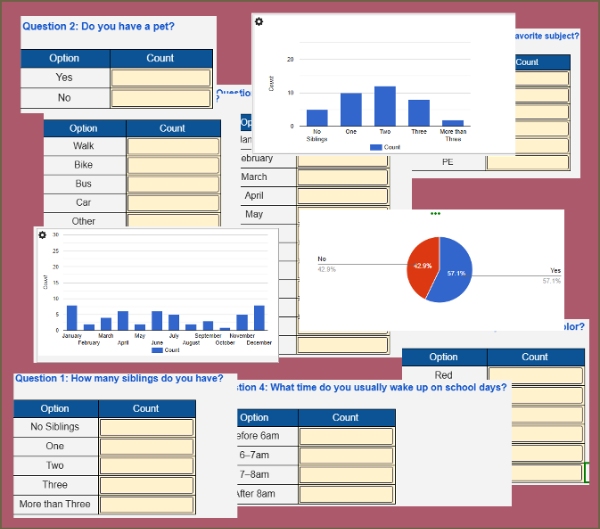
Students collect and summarize data from a live classroom survey on topics like pets, siblings, and school routines. As they enter values, interactive charts update in real time. Students then analyze the graphs and answer summary questions. A fun way to learn data collection and interpretation!

Mini LabGrade 7· 20 min

Analyzing Samples - What’s the Most Popular Lunch?

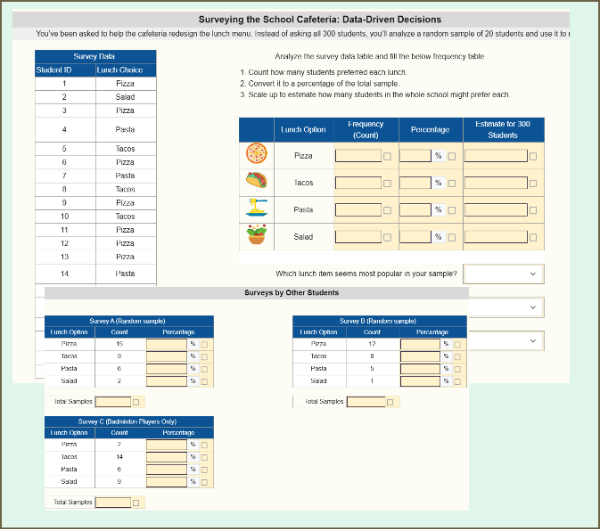
Students analyze a random sample of lunch preferences to estimate the most popular food choices in their school. They compare results from multiple surveys—including a biased one—to understand the importance of sample size and randomness in drawing reliable conclusions.

Skill PracticeGrades 6, 7· 20 min

Building Box Plots from Real Data

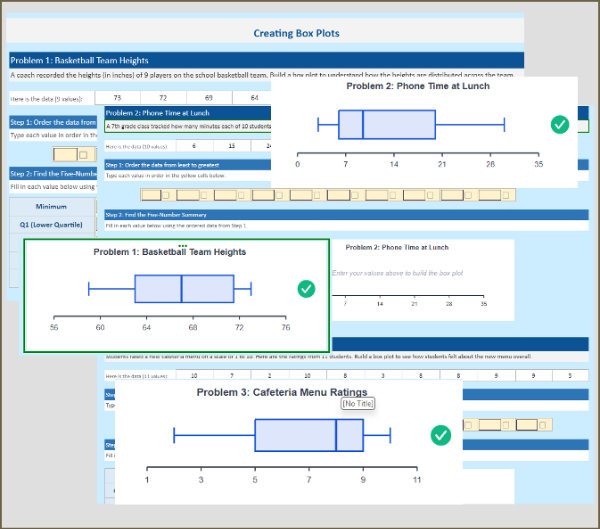
Build fluency with box plots through 3 real-world practice problems. Students sort data, find the five-number summary (Min, Q1, Median, Q3, Max), calculate IQR, and watch the box plot draw itself as they fill in each value. Each problem features a different distribution shape, with instant feedback when answers are correct.

Skill PracticeGrades 6, 7· 15 min

Interpreting Dot Plots

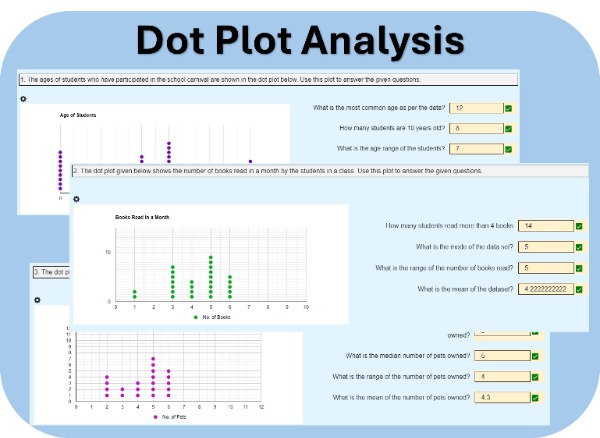
Students will analyze dot plots representing real-world data, such as the ages of students participating in a school carnival. They will answer questions based on these plots. Each student will receive three unique sets of data and questions, encouraging individual analysis and critical thinking.