
6th grade · Statistics & Probability

6.SP.B.5 worksheets and activities

Summarize numerical data sets in relation to their context, such as by:

3 interactive, auto-graded activities for 6th grade students practising 6.SP.B.5. Mini Labs put the standard to work in a real scenario; Skill Practice builds fluency on the standard alone. Every one is randomized per student, so each learner gets their own numbers.

6.SP.B.5 worksheets: Mini Labs and Skill Practice

Skill PracticeGrades 6, 7· 15 min

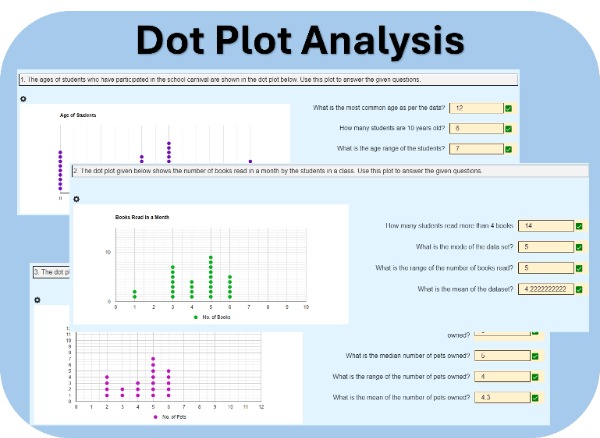
Interpreting Dot Plots

Students will analyze dot plots representing real-world data, such as the ages of students participating in a school carnival. They will answer questions based on these plots. Each student will receive three unique sets of data and questions, encouraging individual analysis and critical thinking.
Skill PracticeGrade 7· 20 min

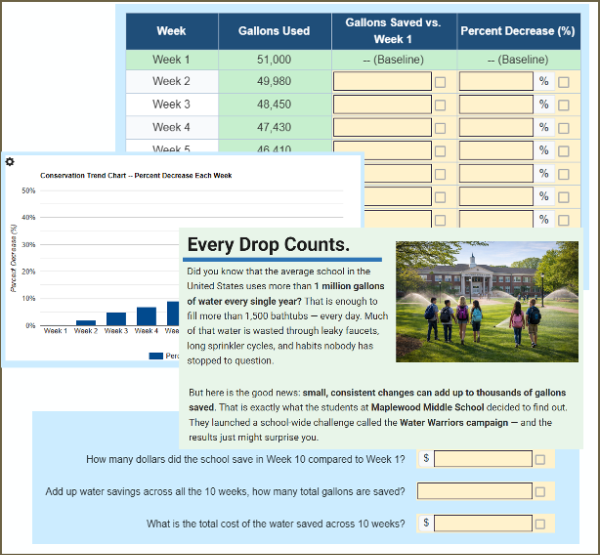
Mean, Median, Mode, Range & IQR

Students will analyze five different data sets, each representing a real-life scenario such as weekly attendance or pages read by students. Their task is to calculate the mean, median, mode, range, and interquartile range for each data set, helping them develop essential skills in statistical analysis.

Sub-standards

Other 6th grade Statistics & Probability standards

Assign a 6.SP.B.5 activity in minutes

Preview any activity for free. Create a free teacher account to assign it to your class, see every student's work live, and get results auto-graded.