Interpreting Dot Plots

Students will analyze dot plots representing real-world data, such as the ages of students participating in a school carnival. They will answer questions based on these plots. Each student will receive three unique sets of data and questions, encouraging individual analysis and critical thinking.

In this worksheet, students will engage in analyzing dot plots that represent real-world data scenarios. For example, one of the plots may show the ages of students who participated in a school carnival. Students will carefully examine these plots and answer a series of questions designed to deepen their understanding of data distribution and statistical measures.

Activity Overview:

  • Real-World Data Analysis: Students will work with dot plots that depict real-life situations, such as age distributions at a school event. This helps students relate mathematical concepts to everyday experiences.
  • Three Unique Sets of Data: Each student will be provided with three different dot plots, each accompanied by a set of questions.
  • Answering Targeted Questions: Students will analyze the dot plots to answer questions related to the data.


Key Features:

  • Auto-Graded: This interactive digital worksheet is auto-graded, eliminating the need for teachers to evaluate it manually, making it an excellent practice activity.
  • Unique Questions: Each student will receive a unique set of 3 dot plots to promote individual practice and understanding.
  • Re-Assignable: Re-assigning the worksheet to the same classroom will generate a new set of questions for each student.


Learning Objective

Students will interpret and analyze dot plots to determine key statistical measures, including mode, mean, median, and range. They will also answer contextual questions to develop fluency in reading and reasoning with data representations.

Randomization Available

If randomization is enabled, each student will receive a different dot plot to analyze. This prevents copying of answers.

💡 Tip: When assigning this activity to your classroom, you can optionally enable randomization to give each student a unique version of the problems. When you re-assign the same worksheet, each student will get a new set of questions, helping them master the content through repeated practice.

Interpreting Dot Plots preview
Preview
Grade level
6, 7
Type
Skill Practice
Duration
15 minutes
Auto-graded
Yes
Randomized per student
Yes
Topics
StatisticsRandom SamplesInterpreting Data
Tags
Practice WorksheetTimed DrillBell Ringer

Related grades 6, 7 activities

More interactive, auto-graded activities on the same standards and topics.

Skill PracticeGrades 6, 7, 8· 20 min

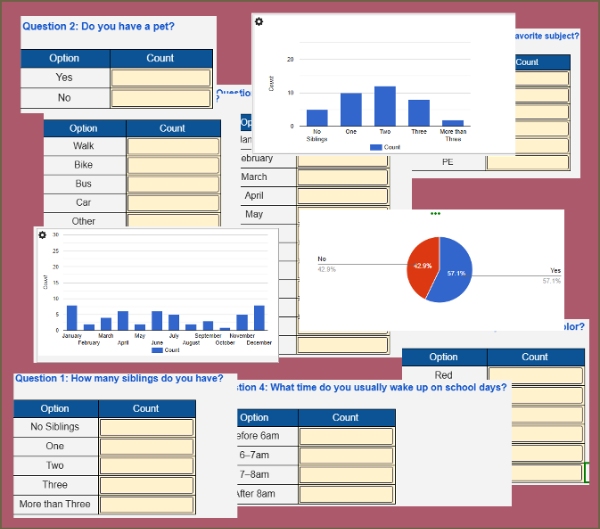
Back to School: Know Your Classroom

Students collect and summarize data from a live classroom survey on topics like pets, siblings, and school routines. As they enter values, interactive charts update in real time. Students then analyze the graphs and answer summary questions. A fun way to learn data collection and interpretation!

Skill PracticeGrades 6, 7· 20 min

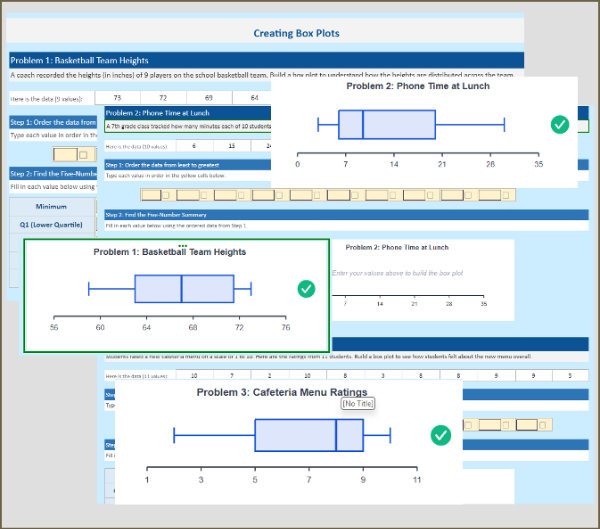
Building Box Plots from Real Data

Build fluency with box plots through 3 real-world practice problems. Students sort data, find the five-number summary (Min, Q1, Median, Q3, Max), calculate IQR, and watch the box plot draw itself as they fill in each value. Each problem features a different distribution shape, with instant feedback when answers are correct.

Skill PracticeGrade 7· 20 min

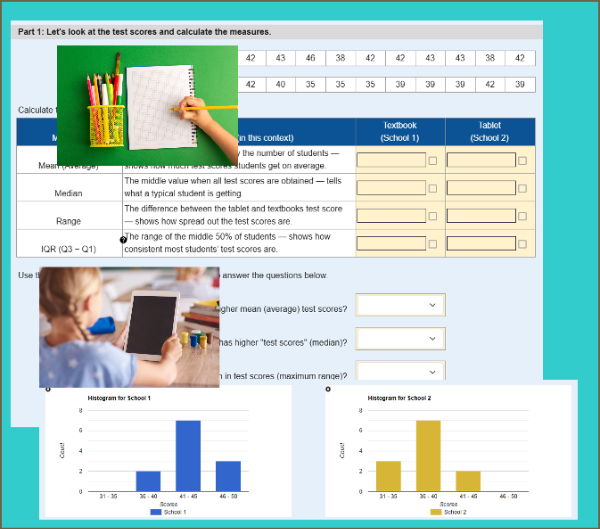
Mean, Median, Mode, Range & IQR

Students will analyze five different data sets, each representing a real-life scenario such as weekly attendance or pages read by students. Their task is to calculate the mean, median, mode, range, and interquartile range for each data set, helping them develop essential skills in statistical analysis.

Mini LabGrades 7, 8· 15 min

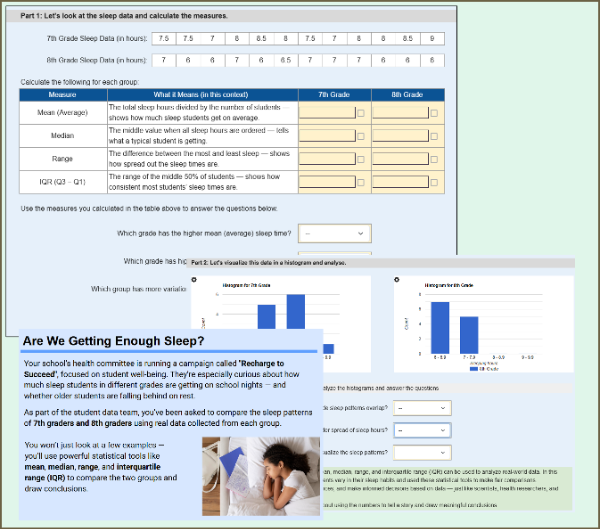
Sleep Patterns: Mean, Median, Range, IQR & Histogram

Students compare the sleep patterns of 7th and 8th graders using real-world data. They calculate mean, median, range, and IQR, then interpret histograms and make informal inferences about group differences. This worksheet supports randomization, so each student may receive different sleep data.