8th grade · Statistics & Probability

8.SP.A.2 worksheets and activities

Know that straight lines are widely used to model relationships between two quantitative variables. For scatter plots that suggest a linear association, informally fit a straight line, and informally assess the model fit by judging the closeness of the data points to the line.

5 interactive, auto-graded activities for 8th grade students practising 8.SP.A.2. Mini Labs put the standard to work in a real scenario; Skill Practice builds fluency on the standard alone. Every one is randomized per student, so each learner gets their own numbers.

8.SP.A.2 worksheets: Mini Labs and Skill Practice

Mini LabGrade 8· 15 min

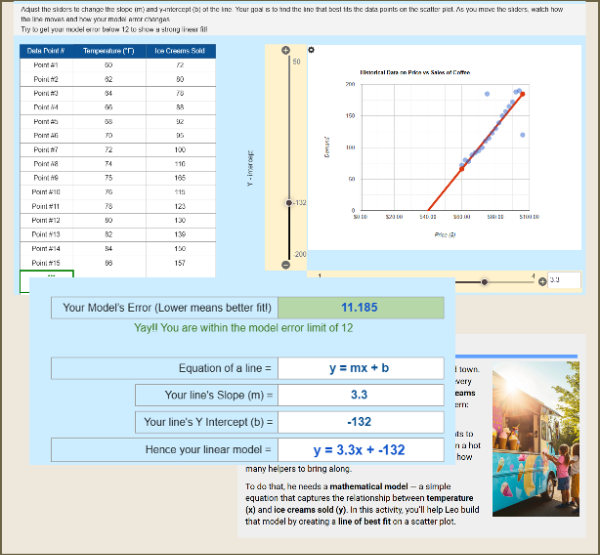
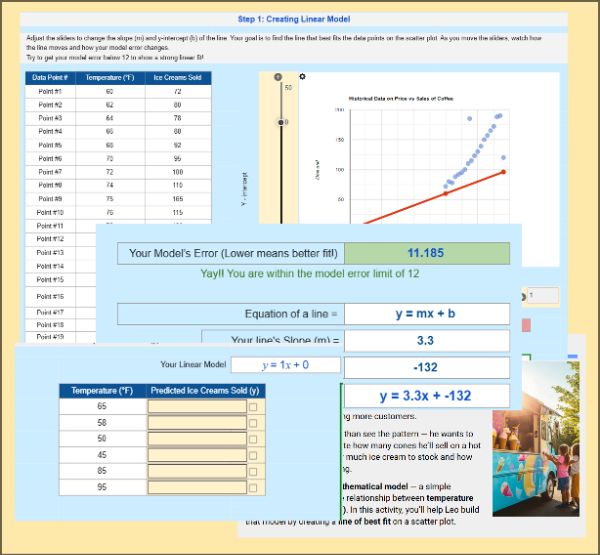
Modeling Ice Cream Sales: Creating Linear Model (Part 2)

Students help Leo, an ice cream truck owner, build a linear model to predict sales! Using interactive sliders to adjust slope and intercept, they create the best-fit line, minimize model error, and discover how straight lines can model real-world data relationships.
Mini LabGrade 8· 20 min

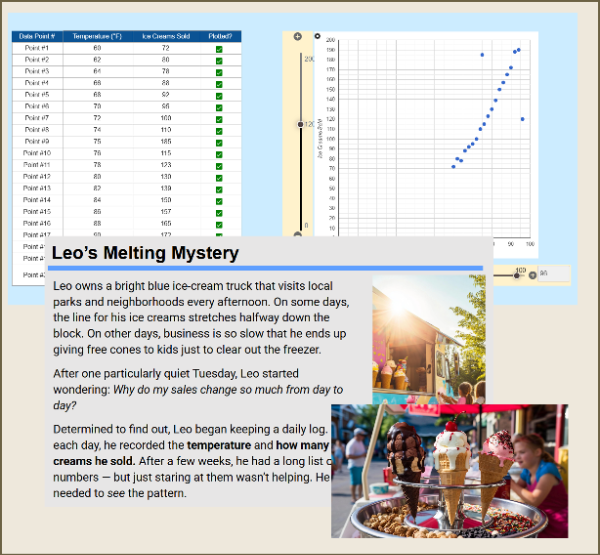
Leo’s Ice Cream Sales: Building a Scatter Plot (Part 1)

Help Leo, an ice cream truck owner, uncover how weather affects his sales! Students plot real data points to create a scatter plot, identify trends, and spot outliers. This engaging, hands-on activity builds understanding of correlation, trend lines, and data interpretation using a fun, real-world scenario.

Mini LabGrade 8· 20 min

From Pattern to Prediction: Modeling Ice Cream Sales

Students help Leo, an ice cream truck owner, analyze sales data by creating and using a linear model. Using sliders to adjust slope and intercept, they minimize model error, find the best-fit line, and predict sales for new temperatures—discovering how data models are built and used in the real world.

Mini LabGrade 8· 20 min

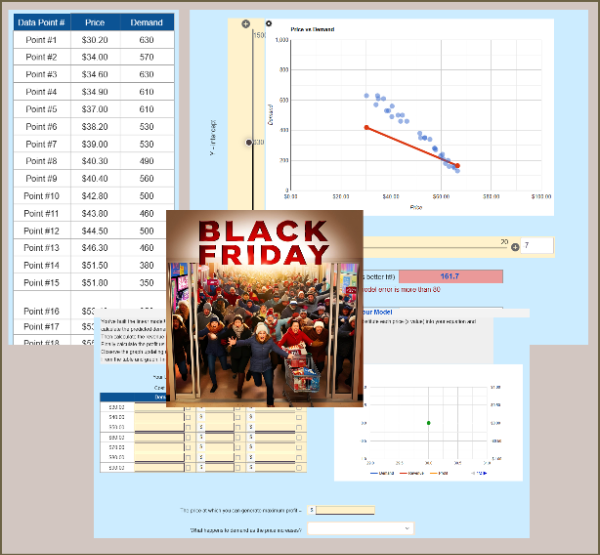
Black Friday Demand Curve & Profit Maximization

Students build a linear model from a price–demand scatterplot, then use it to predict demand, revenue, and profit at different price points. They analyze curves and determine the price that maximizes profit. A perfect real-world 8th-grade activity for scatterplots, linear modeling, and financial reasoning.

Multi-day Labs that cover 8.SP.A.2

Labs run 2 to 4 class periods and connect several standards into one project.

LabGrade 8· 180 min

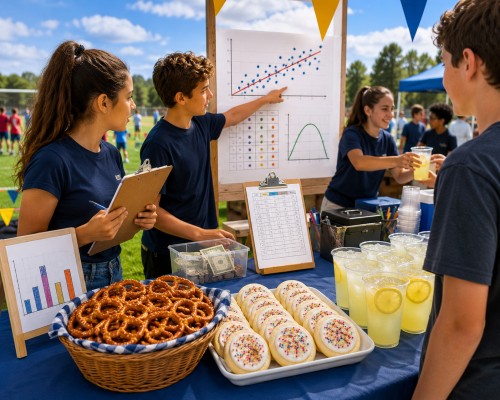
Snack Stand: Pricing with Scatter Plots and Linear Models

Snack Stand Showdown is a Grade 8 statistics lab where students run a Field Day snack stand and use real data to decide what to charge and how much to buy. They build scatter plots, fit lines of best fit, price from profit curves, place a budgeted vendor order, and read two-way tables. A connected, auto-graded arc covering the full 8.SP standard cluster.

Other 8th grade Statistics & Probability standards

Assign a 8.SP.A.2 activity in minutes

Preview any activity for free. Create a free teacher account to assign it to your class, see every student's work live, and get results auto-graded.