Modeling Ice Cream Sales: Creating Linear Model (Part 2)

Students help Leo, an ice cream truck owner, build a linear model to predict sales! Using interactive sliders to adjust slope and intercept, they create the best-fit line, minimize model error, and discover how straight lines can model real-world data relationships.

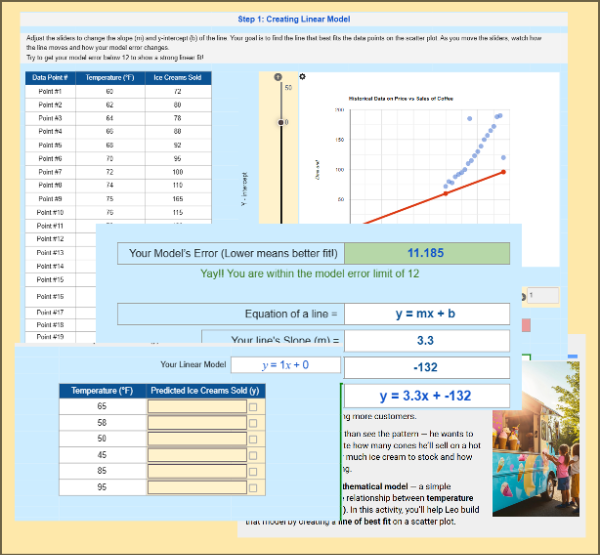
In this interactive 8th-grade statistics lab, students explore how straight lines can model real-world data relationships. They help Leo, an ice cream truck owner, analyze his sales data by adjusting sliders for slope and intercept to create the line of best fit. As they fine-tune the line, the model error updates dynamically, showing how accuracy improves when a model fits closely to the data.


Students learn how linear models summarize relationships between two quantitative variables, gain insight into how slope and y-intercept shape the model, and understand what it means for a model to “fit” well. Through this hands-on, visual experience, they connect abstract math concepts to real-world applications used by data analysts, scientists, and businesses to make predictions and decisions.


Aligned with CCSS.MATH.CONTENT.8.SP.A.2, this activity turns data modeling into an engaging, interactive challenge that helps students see the power of math in action.

Learning Objective

Students will learn how to build and evaluate a linear model that represents the relationship between two quantitative variables. By adjusting the slope and y-intercept to minimize model error, students will understand how a line of best fit summarizes data trends and how model accuracy reflects how closely the line represents real-world data.

Modeling Ice Cream Sales: Creating Linear Model (Part 2) preview
Preview
Grade level
8
Type
Mini Lab (real-world worksheet)
Duration
15 minutes
Auto-graded
Yes
Common Core standards
8.SP.A.2
Topics
StatisticsScatter PlotsTrend LinesBivariate Data Analysis

Related grade 8 activities

More interactive, auto-graded activities on the same standards and topics.

LabGrade 8· 180 min

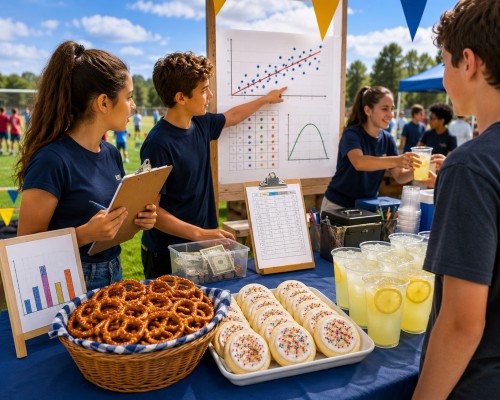
Snack Stand: Pricing with Scatter Plots and Linear Models

Snack Stand Showdown is a Grade 8 statistics lab where students run a Field Day snack stand and use real data to decide what to charge and how much to buy. They build scatter plots, fit lines of best fit, price from profit curves, place a budgeted vendor order, and read two-way tables. A connected, auto-graded arc covering the full 8.SP standard cluster.

Mini LabGrade 8· 20 min

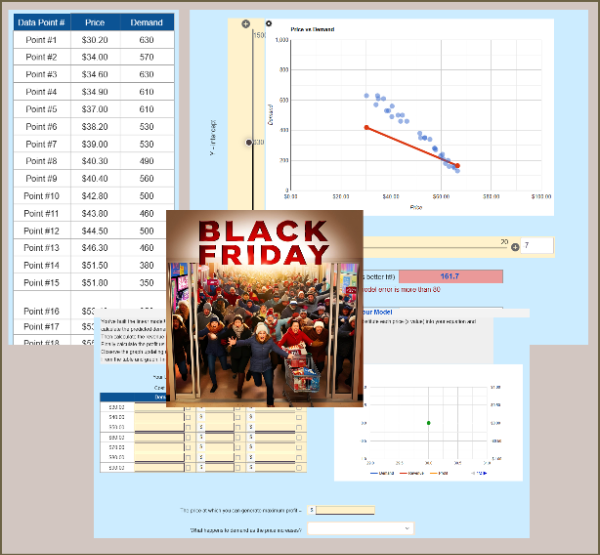
Black Friday Demand Curve & Profit Maximization

Students build a linear model from a price–demand scatterplot, then use it to predict demand, revenue, and profit at different price points. They analyze curves and determine the price that maximizes profit. A perfect real-world 8th-grade activity for scatterplots, linear modeling, and financial reasoning.

Mini LabGrade 8· 20 min

From Pattern to Prediction: Modeling Ice Cream Sales

Students help Leo, an ice cream truck owner, analyze sales data by creating and using a linear model. Using sliders to adjust slope and intercept, they minimize model error, find the best-fit line, and predict sales for new temperatures—discovering how data models are built and used in the real world.

Mini LabGrade 8· 20 min

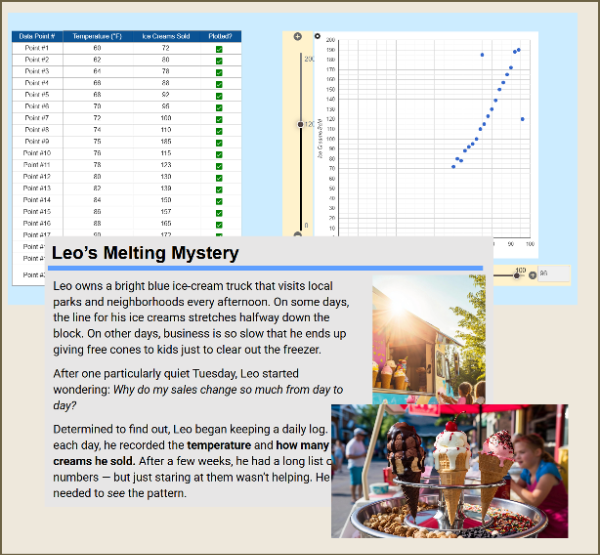
Leo’s Ice Cream Sales: Building a Scatter Plot (Part 1)

Help Leo, an ice cream truck owner, uncover how weather affects his sales! Students plot real data points to create a scatter plot, identify trends, and spot outliers. This engaging, hands-on activity builds understanding of correlation, trend lines, and data interpretation using a fun, real-world scenario.

Skill PracticeGrades 6, 7, 8· 20 min

Back to School: Know Your Classroom

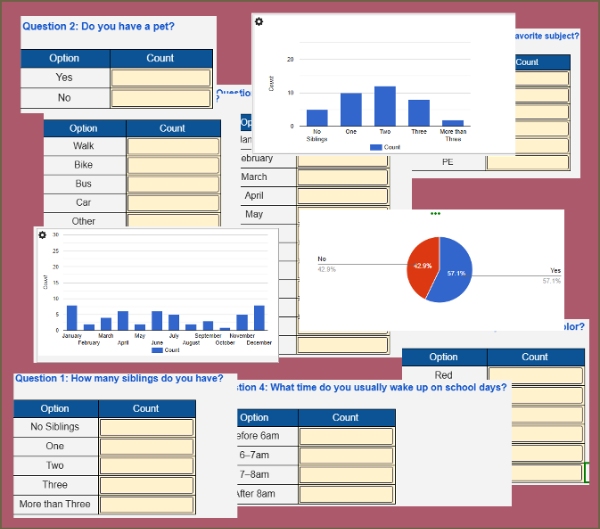
Students collect and summarize data from a live classroom survey on topics like pets, siblings, and school routines. As they enter values, interactive charts update in real time. Students then analyze the graphs and answer summary questions. A fun way to learn data collection and interpretation!