Equation of a Line from Real-World Graphs, Predict Unknowns

Students explore real-world linear relationships by analyzing graphs, identifying slope and y-intercept, and writing equations in slope-intercept form. Using real data from everyday scenarios, they model situations, create equations, and predict unknown values. Ideal for building conceptual understanding of y=mx+b.

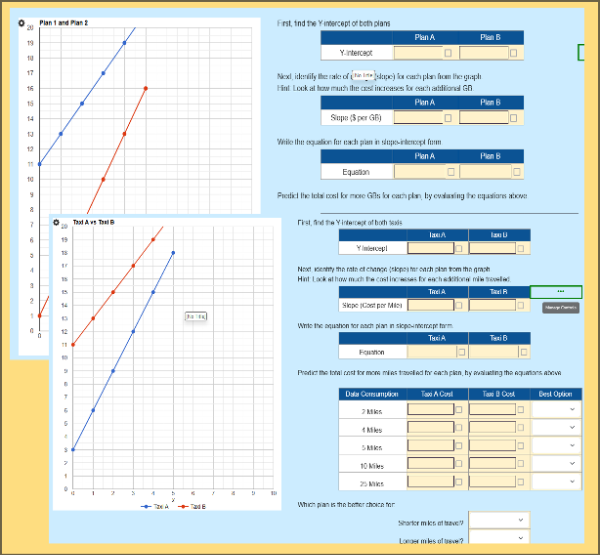
This interactive worksheet helps students understand how linear equations in slope-intercept form are used to model and predict real-world situations. Instead of memorizing formulas, students analyze real data, read graphs, identify slope and y-intercept, and write equations that allow them to predict values beyond what was recorded.


Students work through multiple realistic scenarios where historical data has already been collected. Their task is to turn that data into a mathematical model using y=mx + b reinforcing both conceptual understanding and practical application.


What students will do

  • Read and interpret real-world data displayed on graphs
  • Identify the y-intercept as the starting value
  • Calculate the slope
  • Write linear equations in slope-intercept form
  • Use equations to predict unknown values
  • Understand why equations are more powerful than graphs for prediction


Real-World Scenarios Included

  • Coffee Loyalty Program
  • A customer tracks loyalty spending over multiple purchases and wants to predict future balances.
  • Phone Battery Usage
  • A phone’s battery drains at a steady rate while streaming, and the user wants to predict remaining battery life.
  • Internet Data Usage Cost
  • A customer records how internet costs increase with data usage and wants to estimate future bills.


Why teachers love this worksheet

  • Strong real-world connections that motivate learning
  • Clear focus on prediction using linear equations
  • Builds conceptual understanding before formal practice
  • Supports randomization, giving each student different graphs and values
  • Ideal for classwork, homework, or formative assessment


This activity is perfect for helping students see why linear equations matter, how slope and y-intercept describe real situations, and how equations turn past data into powerful tools for predicting the future.

Learning Objective

Students will identify the slope and y-intercept of a linear relationship from a graph and use them to write equations in the form y = mx + b. They will apply these equations to model real-world situations and predict values not shown on the graph.

Randomization Available

This worksheet supports randomization. When enabled, each student will receive graphs with different y-intercepts and different sets of points, ensuring individualized practice and reducing copying.

💡 Tip: When assigning this activity to your classroom, you can optionally enable randomization to give each student a unique version of the problems. When you re-assign the same worksheet, each student will get a new set of questions, helping them master the content through repeated practice.

Equation of a Line from Real-World Graphs, Predict Unknowns preview
Preview
Grade level
8
Type
Mini Lab (real-world worksheet)
Duration
20 minutes
Auto-graded
Yes
Randomized per student
Yes
Common Core standards
8.EE.B.58.EE.B.68.EE.C.78.F.A.3
Topics
Expressions & EquationsSolving EquationsUsing Variables in ContextLinear Equations
Tags
Real WorldFinancial CalculationsGraph-Based

Related grade 8 activities

More interactive, auto-graded activities on the same standards and topics.

LabGrade 8· 120 min

Food Truck Using Expressions & Functions

Curbside is an interactive Grade 8 math lab where students run a food truck and use real math to decide if it makes money. Across 7 auto-graded worksheets they build revenue, cost, break-even, and profit, compare competitors, and weigh a marketing curve. A hands-on way to make expressions, equations, and functions feel real. Common Core aligned (8.EE, 8.F).

Mini LabGrade 8· 20 min

Comparing Linear Models: Which Changes Faster?

Students compare real-world linear models by analyzing graphs, identifying slope and y-intercept, writing equations in slope-intercept form, and predicting values. Through an internet plan comparison, learners use equations to determine the better option for low and high usage, building strong conceptual understanding of linear relationships.

Skill PracticeGrade 8· 20 min

Calculating Slope from Two Points on a Graph

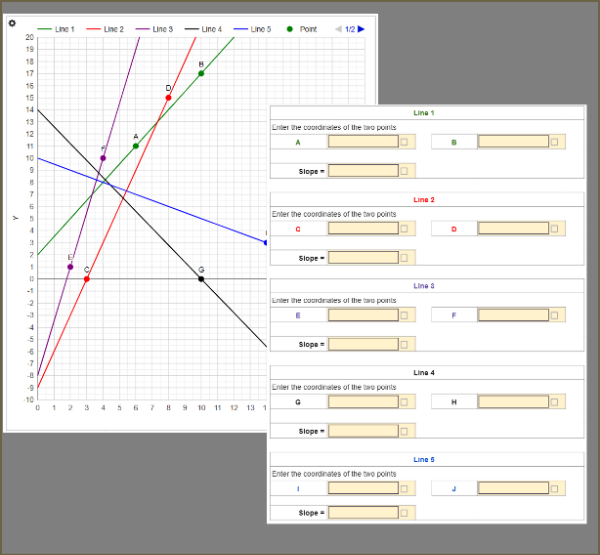
Help students master slope using real graphs. In this interactive worksheet, learners identify coordinates, apply the slope formula, and compare slopes of multiple lines. Supports randomization so each student receives different lines and points, making it perfect for 8th-grade slope practice.

Skill PracticeGrade 8· 20 min

Interactive Slope Investigation: Finding Δy and Δx

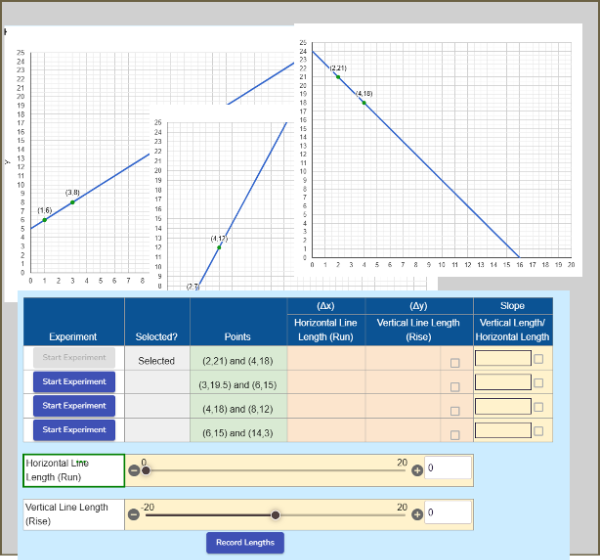
Explore slope through hands-on experiments! Students use sliders to measure rise (Δy) and run (Δx) between two points, calculate slope, and compare lines with positive and negative slopes. A visual, interactive way to understand steepness, direction, and why slope stays constant on a linear graph.

Skill PracticeGrade 8· 20 min

Linear Equations with Variables on Both Sides

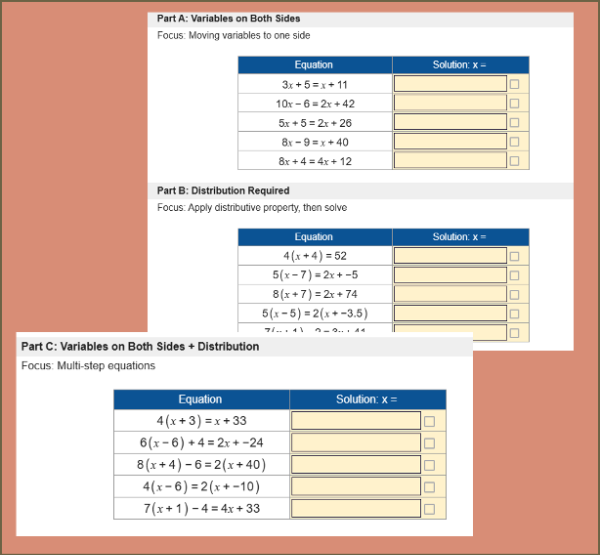
Practice solving linear equations with variables on both sides. Students use distribution, combine like terms, and isolate the variable in this auto-graded worksheet. Supports randomization so every student receives unique equations. Ideal for Grade 8 algebra practice aligned to CCSS 8.EE.C.7.

Skill PracticeGrades 7, 8· 30 min

Proportional Relation– Build the Graph

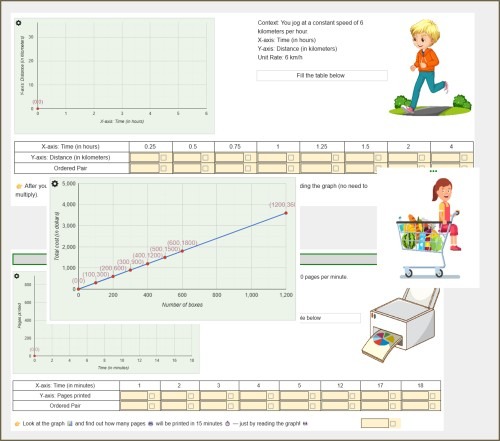
Students explore proportional relationships by completing tables and graphs for real-world scenarios like jogging and packaging costs. They’ll use unit rates, plot ordered pairs, and observe how proportional relationships form straight lines through the origin.