Food Truck Using Expressions & Functions

Curbside is an interactive Grade 8 math lab where students run a food truck and use real math to decide if it makes money. Across 7 auto-graded worksheets they build revenue, cost, break-even, and profit, compare competitors, and weigh a marketing curve. A hands-on way to make expressions, equations, and functions feel real. Common Core aligned (8.EE, 8.F).

Curbside: A Grade 8 Food Truck Math Lab (Expressions, Equations & Functions)


Turn linear functions into a real business decision. In Curbside, each student becomes the owner of a food truck and answers the one question every owner asks: will this actually make money? Across seven connected, interactive worksheets, students build their entire business model with math and finish by making a real go or no-go launch decision, backed by their own numbers.


Unlike static practice sheets, every Curbside worksheet is a live, spreadsheet-powered model. When a student changes an input, the numbers, tables, and graphs recalculate instantly, and answers are validated on the spot. Students learn by manipulating variables and watching what happens, which builds genuine understanding of how expressions, equations, and functions work in the real world.


What students do

  • Write and interpret a revenue function from a price per meal
  • Build a cost function with fixed and variable costs, and see the line lift off zero
  • Solve for the break-even point where revenue meets cost
  • Construct a profit function and apply it across six real months of sales
  • Compare their business against two rival trucks shown as a table and a graph
  • Explore a marketing curve and discover why spending more is not always worth it
  • Make a final, evidence-based launch recommendation


Why teachers choose Curbside

  • Fully auto-graded with immediate feedback and per-question scoring
  • Real-time teacher dashboard shows who started, who finished, and who is stuck
  • One connected storyline, so the math never feels like seven separate drills
  • Realistic prices and scenarios sized for U.S. middle school students
  • Flexible to run as a one to two day capstone or one worksheet per lesson
  • Supplements your existing curriculum rather than replacing it


Common Core standards covered

  • 8.EE.B.5, 8.EE.B.6 (proportional relationships, slope, and the y-intercept)
  • 8.EE.C.7, 8.EE.C.8 (solving linear equations and systems)
  • 8.F.A.1, 8.F.A.2, 8.F.A.3 (defining, comparing, and classifying functions)
  • 8.F.B.4, 8.F.B.5 (modeling and describing linear and nonlinear functions)


Grade level: 8 (works as a first application of linear functions or a rich review unit)


Format: 7 interactive, auto-graded ActiveLearningSheets plus intro slides and a teacher guide


Prep time: Minimal. Assign it, open your dashboard, and go.

Give students a reason to care about the math they are already learning. With Curbside, expressions, equations, and functions stop being abstract and start being the tools that decide whether a business succeeds.

Food Truck Using Expressions & Functions preview
Preview
Grade level
8
Type
Lab
Duration
60 minutes
Auto-graded
Yes
Topics
Expressions & EquationsFunctionsSolving EquationsUsing Variables in ContextLinear EquationsSystems of Equations
Tags
Real World

Related grade 8 activities

More interactive, auto-graded activities on the same standards and topics.

Mini LabGrade 8· 20 min

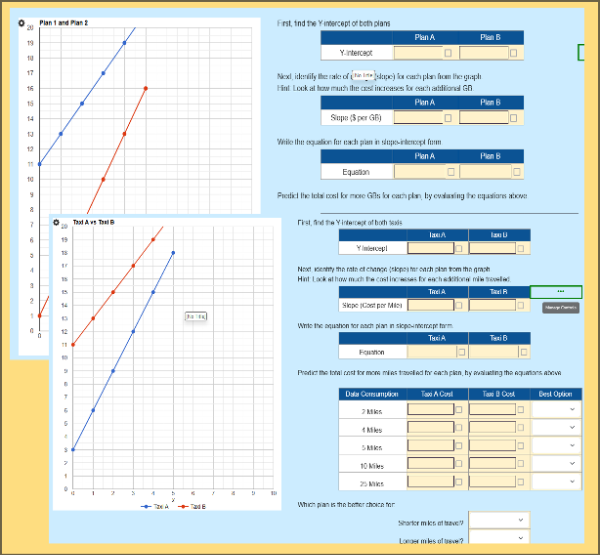
Comparing Linear Models: Which Changes Faster?

Students compare real-world linear models by analyzing graphs, identifying slope and y-intercept, writing equations in slope-intercept form, and predicting values. Through an internet plan comparison, learners use equations to determine the better option for low and high usage, building strong conceptual understanding of linear relationships.

Mini LabGrade 8· 20 min

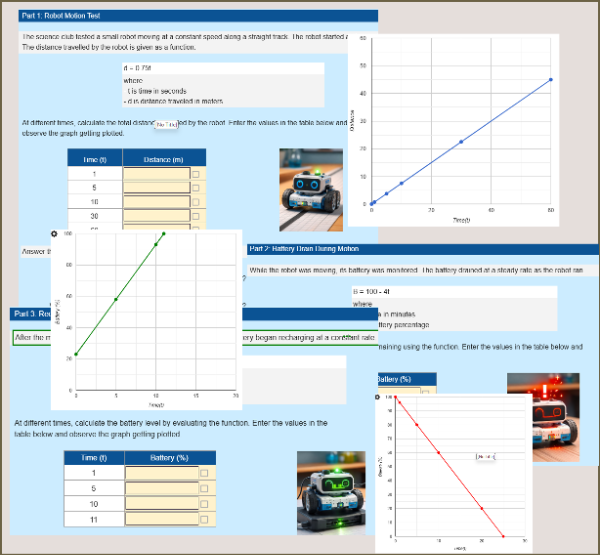
Physics Lab Data: Graphing Functions

Analyze real physics experiments using linear functions in this interactive worksheet. Students graph given functions for robot motion, battery drain, and battery charging, then interpret slopes and intercepts in context. Aligned to CCSS 8.F.A.1, this activity builds strong intuition for functions through meaningful graphs and real-world data.

Skill PracticeGrade 8· 20 min

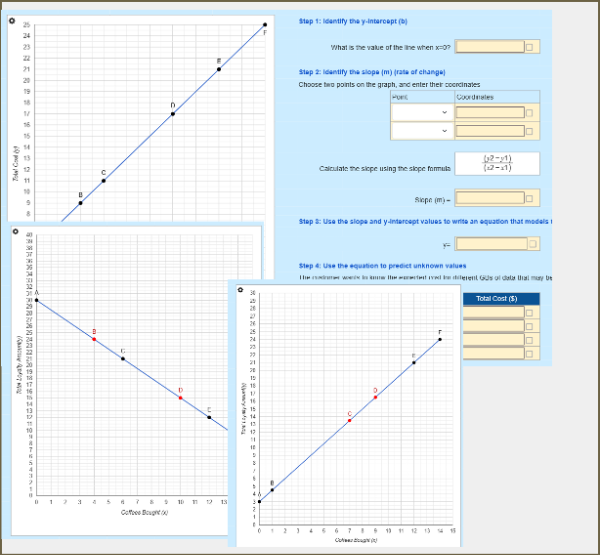
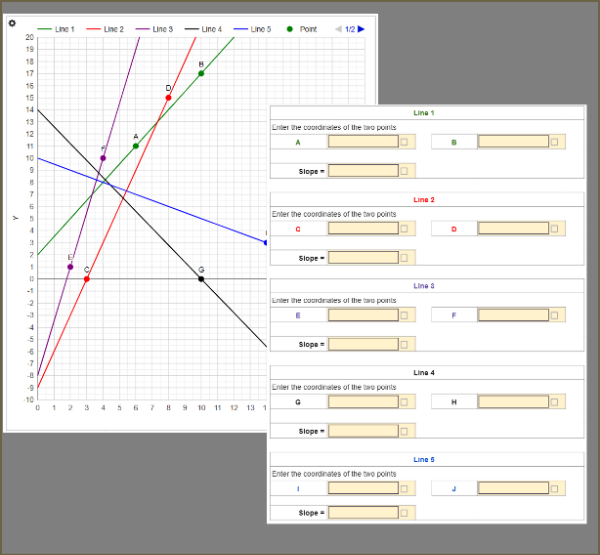
Calculating Slope from Two Points on a Graph

Help students master slope using real graphs. In this interactive worksheet, learners identify coordinates, apply the slope formula, and compare slopes of multiple lines. Supports randomization so each student receives different lines and points, making it perfect for 8th-grade slope practice.

Mini LabGrade 8· 20 min

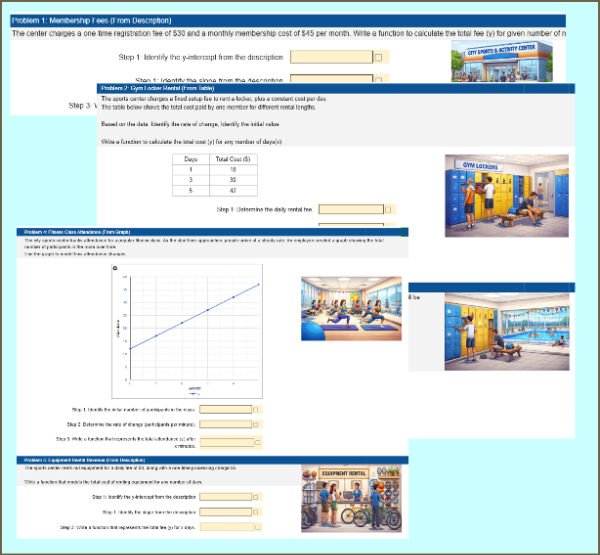
City Sports & Activity Center: Create Functions from Real-World Situation

Students construct linear functions to model real-world situations at a city sports and activity center. Using descriptions, tables, graphs, and data points, they identify rates of change and initial values, write equations in the form y = mx + b, and interpret slope and intercept in context. Aligned to CCSS 8.F.B.4 and ideal for practice or assessment.

Mini LabGrade 8· 20 min

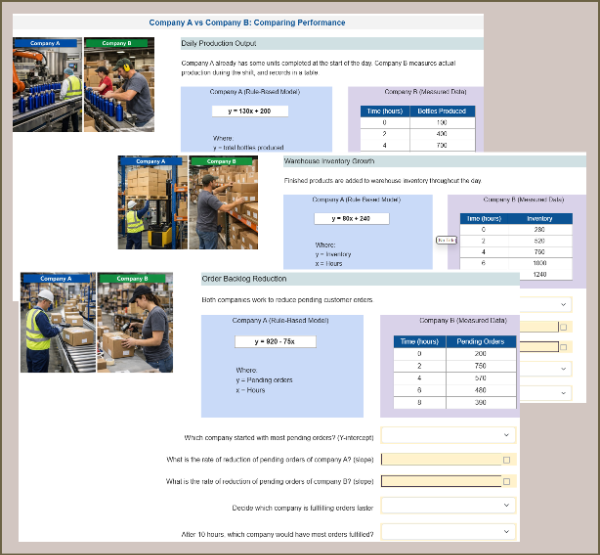
Comparing Delivery Performance: Algebraic & Tabular Functions

Students compare two linear functions represented in different forms: one as an algebraic equation and the other as a table of values. Using real-world company operations like production, inventory, and order fulfillment, students identify slopes and intercepts to determine which function changes faster and justify their reasoning.