Build It, Then Predict It! – Compound Probability with Drag & Drop

Practice compound probability by building outcome combinations using drag-and-drop. Students explore real-life scenarios and calculate probabilities from organized tables.

In this interactive 7th grade math worksheet, students explore compound probability by analyzing real-world scenarios with two independent events. Using a drag-and-drop format, students build all possible outcome combinations, organize them into tables, and calculate the probability of specific outcomes. This hands-on worksheet helps students visualize the sample space and strengthens their understanding of how compound events work.


Key features:

  • ✅ Real-life, relatable scenarios like food choices, coin flips, and spinners
  • ✅ Drag-and-drop interaction to build organized outcome sets
  • ✅ Questions focused on total outcomes and compound probability
  • ✅ Supports both fractional and decimal answers
  • ✅ Aligned with Common Core 7.SP.8b — using lists and tables to determine probability


This worksheet is perfect for reinforcing conceptual understanding before introducing tree diagrams or formulas. Great for classwork, practice, or skill assessment.

Learning Objective

Students will determine compound probabilities by creating and analyzing organized lists and tables of outcomes for two independent events. They will calculate the total number of possible combinations and use this information to find the probability of a specific outcome occurring.

Build It, Then Predict It! – Compound Probability with Drag & Drop preview
Preview
Grade level
7
Type
Mini Lab (real-world worksheet)
Duration
15 minutes
Auto-graded
Yes
Common Core standards
7.SP.C.8b
Topics
StatisticsTheoretical and Experimental ProbabilityProbability Rules
Tags
Real WorldPractice WorksheetTabular FormatDrag and Drop

Related grade 7 activities

More interactive, auto-graded activities on the same standards and topics.

Skill PracticeGrades 6, 7, 8· 20 min

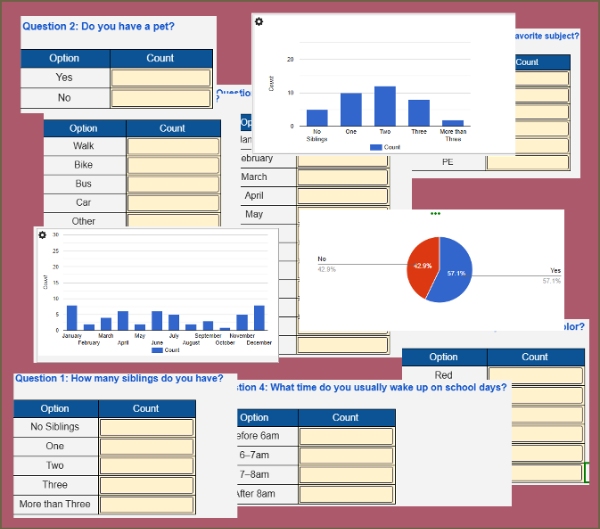
Back to School: Know Your Classroom

Students collect and summarize data from a live classroom survey on topics like pets, siblings, and school routines. As they enter values, interactive charts update in real time. Students then analyze the graphs and answer summary questions. A fun way to learn data collection and interpretation!

Skill PracticeGrades 6, 7· 20 min

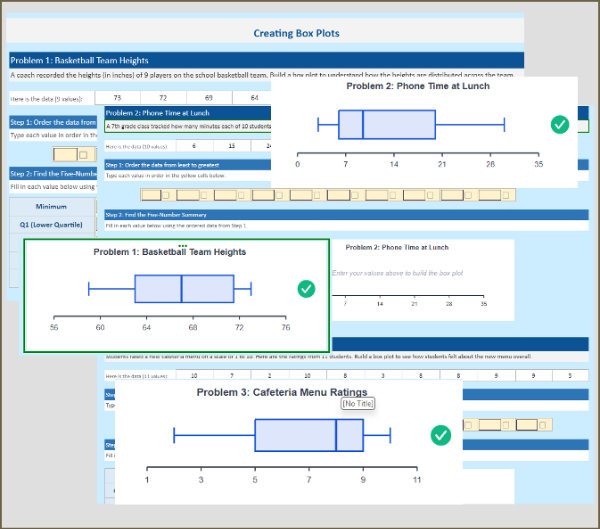
Building Box Plots from Real Data

Build fluency with box plots through 3 real-world practice problems. Students sort data, find the five-number summary (Min, Q1, Median, Q3, Max), calculate IQR, and watch the box plot draw itself as they fill in each value. Each problem features a different distribution shape, with instant feedback when answers are correct.

Skill PracticeGrades 6, 7· 15 min

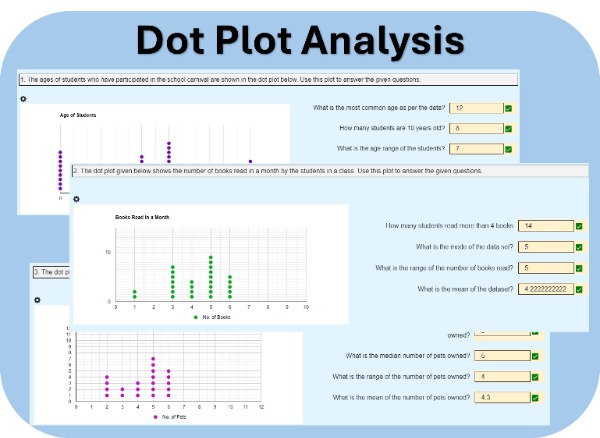
Interpreting Dot Plots

Students will analyze dot plots representing real-world data, such as the ages of students participating in a school carnival. They will answer questions based on these plots. Each student will receive three unique sets of data and questions, encouraging individual analysis and critical thinking.

Skill PracticeGrades 6, 7· 20 min

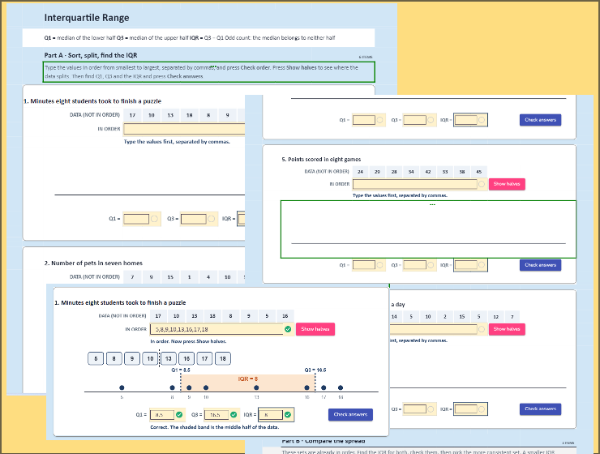
IQR: Sort, Split and Find the Middle Half

Students put a data set in order, split it into halves, and find Q1, Q3 and the interquartile range one guided step at a time. Feedback names the exact mistake, and a number line shades the middle half once they get it right. 8 auto-graded questions, randomized for every student and aligned to 6.SP.B.5c. Assign it for a 20 to 30 minute practice block.