Fuel Up! – Road Trip Ratio Challenge

In this real-world math challenge, students use ratio and unit rate skills to plan a 1,250-mile road trip. They analyze past vehicle data, calculate miles per gallon, total costs, and compare options to choose the most cost-effective car.

In this interactive worksheet, students step into the role of a 13-year-old trip planner tasked with organizing their family’s 1,250-mile road trip to Yellowstone National Park. The challenge? Choose the most cost-effective rental car by analyzing fuel efficiency, rental rates, and overall trip costs.


Students begin with realistic vehicle data, including total miles traveled and gallons of fuel used on past trips. They’ll compute unit rates (miles per gallon), calculate total gallons needed for the upcoming journey, and determine total fuel expenses based on fluctuating gas prices. They'll also factor in rental costs to arrive at the complete cost for each vehicle option.


Along the way, students engage in problem-solving, percent increase calculations (e.g., a mid-trip fuel price hike), and critical thinking as they justify their final car selection.


This worksheet emphasizes unit rate mastery, multi-step ratio reasoning, and real-life decision-making. With built-in randomization, each student receives unique data, encouraging independent thinking and eliminating answer sharing.


Perfect for reinforcing 7th grade ratio and proportional relationship standards, this worksheet blends math and life skills into a meaningful, applied learning experience.

Learning Objective

Students will apply their understanding of unit rates and proportional relationships to solve a real-world problem involving travel and fuel efficiency. By analyzing trip data from past vehicle usage, they will compute unit rates (miles per gallon), use these rates to determine fuel needs for a 1,250-mile journey, and calculate total trip costs by incorporating rental fees and fuel expenses. Students will also explore percent increases in fuel prices and justify their vehicle selection based on both cost and reasoning.

Randomization Available

To promote individualized learning and discourage copying, this worksheet uses randomized values for each student. Key data points such as miles traveled, gallons of fuel used, rental rates, and fuel prices are automatically varied for each student. As a result, students will compute unique unit rates, total fuel costs, and final trip decisions, ensuring that every learner engages with their own personalized version of the problem.

💡 Tip: When assigning this activity to your classroom, you can optionally enable randomization to give each student a unique version of the problems. When you re-assign the same worksheet, each student will get a new set of questions, helping them master the content through repeated practice.

Fuel Up! – Road Trip Ratio Challenge preview
Preview
Grade level
7
Type
Mini Lab (real-world worksheet)
Duration
20 minutes
Auto-graded
Yes
Randomized per student
Yes
Topics
Ratios & ProportionsRatioUnit Rate
Tags
Real WorldFinancial CalculationsApplicationHomeworkExit Ticket

Related grade 7 activities

More interactive, auto-graded activities on the same standards and topics.

LabGrade 7· 120 min

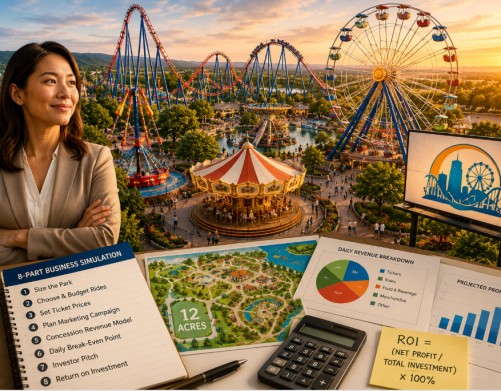
Theme Park Tycoon - A Ratios & Proportions Lab

Theme Park Tycoon is an 8-part Grade 7 ratios and proportions project where students design Aurora Park for an investor. Every worksheet's numbers carry forward, so their choices on rides, pricing, and budget flow into a final ROI they defend. Auto-graded, interactive, and 7.RP-aligned. Real proportional reasoning with real stakes.

LabGrades 6, 7· 120 min

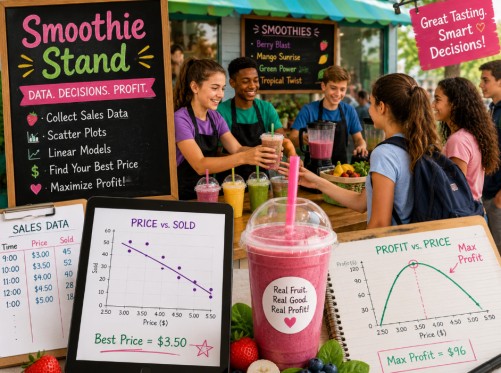
Smoothie Fractions: Run the Bar

Students run a smoothie bar for a day, and every decision is a fraction problem with a real purpose. Six connected, auto-graded interactive worksheets covering multiply, divide, equivalent fractions, compare, and order. Carry-forward story keeps math meaningful. Common Core aligned. Run it in a day or across two weeks.

Mini LabGrade 7· 15 min

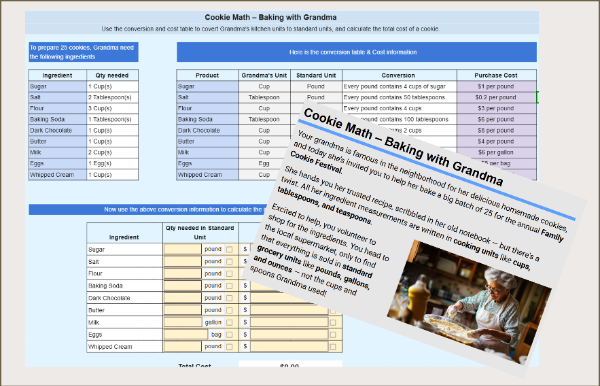
Cookie Ratios – Baking with Grandma’s Recipe

In this real-world math activity, students apply their understanding of ratios and fractions to convert Grandma’s recipe from kitchen units to standard grocery store units. Using a conversion chart and price list, they calculate the quantity and cost of each ingredient, determine the total expense for 25 cookies, and find the cost of one cookie.

Mini LabGrade 7· 20 min

Budgeting for Thanksgiving Feast

In this Thanksgiving-themed math worksheet, students convert ingredient quantities into standard units and calculate the cost of preparing a holiday meal. It’s a real-world activity that strengthens unit conversion, proportional reasoning, and budgeting skills.

Mini LabGrade 7· 15 min

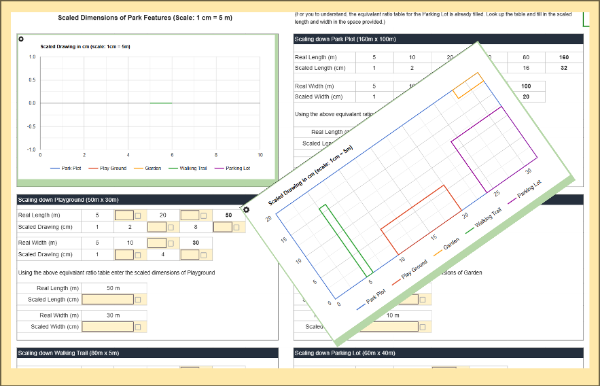
City Park Design Using Equivalent Ratios

In this hands-on activity, students use equivalent ratios to scale down real-world park dimensions and see their design come to life in an automatically generated graph. As they convert measurements, complete ratio tables, and analyze the final layout, they build fluency in proportional reasoning and visual interpretation.

Mini LabGrades 7, 8· 20 min

Community Kitchen - Weekly Budget Planning

In this community kitchen budgeting activity, students convert recipe quantities and calculate the cost of each ingredient needed to prepare a holiday-style meal. Includes turkey, mashed potatoes, gravy, carrots, peas, cranberry sauce, and more.