Back to School: Fundraiser Goal Tracker

Interactive proportional relationships simulation. Students track a club fundraiser at a steady weekly rate, predict weeks to the goal, then see how a head-start donation breaks proportionality. Live graph, auto-graded, randomized values. Grades 7-8 review. CCSS 7.RP.A.2.

Fundraiser Goal Tracker - An Interactive Proportional Relationships Simulation


A short, self-grading activity built for a warm-up or the first week back. A club is raising money for a field trip at a steady weekly rate. Students build a table of totals, find the unit rate, and predict how many weeks it takes to reach the goal. Then a head-start donation lands, and they see why that one change breaks the proportional relationship, even though the money still comes in at the same steady pace.


Takes about 10 minutes, so it fits neatly as a bell-ringer, a review before a linear functions unit, or a back-to-school refresher. Answers check instantly, so you can spot who understands proportionality without grading by hand.


What students practice:

  • Building a table of values from a constant weekly rate
  • Finding the unit rate and using it to predict weeks to the goal
  • Deciding whether a relationship is proportional and explaining why
  • Seeing how a starting amount changes the relationship


Why teachers use it:

  • A live graph students control, with a movable rate and a head-start line they can turn on and off
  • Randomized goals and rates, so every student works a fresh problem
  • No printing, no prep, no manual grading


Standards alignment:

  • Primary: CCSS 7.RP.A.2 (analyze proportional relationships)
  • Informal bridge toward 8.F, with no slope or intercept vocabulary required
  • Review for grades 7 and 8


Perfect for: warm-ups, bell-ringers, back to school, proportional relationships, unit rate, real-world math, and digital math centers.

Learning Objective

Students analyze a proportional relationship in a real fundraising context and recognize what breaks that proportionality. Working from a steady weekly sales rate, they build a table of totals, identify the unit rate, and use it to predict how many weeks it takes to reach a goal. They then examine a second scenario where a head-start donation shifts the starting point, and reason about why the new relationship is no longer proportional. Anchored to 7.RP.A.2, with an informal visual bridge toward 8.F through the graph, no slope or intercept vocabulary required.

Randomization Available

The worksheet supports randomization, if enabled, students will get different target amount, weekly rate, etc.

💡 Tip: When assigning this activity to your classroom, you can optionally enable randomization to give each student a unique version of the problems. When you re-assign the same worksheet, each student will get a new set of questions, helping them master the content through repeated practice.

Back to School: Fundraiser Goal Tracker preview
Preview
Grade level
8
Type
Mini Lab (real-world worksheet)
Duration
10 minutes
Auto-graded
Yes
Randomized per student
Yes
Common Core standards
7.RP.A.2
Topics
Numbers & OperationsRatios & ProportionsRatioUnit RateProportional Relationships
Tags
Real World

Related grade 8 activities

More interactive, auto-graded activities on the same standards and topics.

CompetitionGrades 7, 8· 120 min

Car Manufacturing: Number Challenge

Students apply ratios, percentages, and budgeting skills in this fast-paced, team-based math competition. As co-founders of a vehicle startup, they calculate production costs, analyze sales offers, and race through 10 business cycles—boosting engagement through real-world math, strategy, and collaboration.

Skill PracticeGrades 7, 8· 30 min

Proportional Relation– Build the Graph

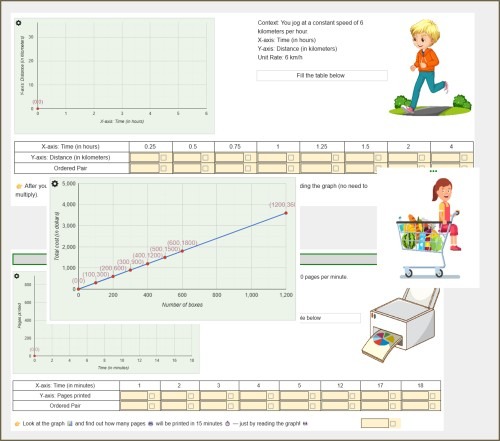
Students explore proportional relationships by completing tables and graphs for real-world scenarios like jogging and packaging costs. They’ll use unit rates, plot ordered pairs, and observe how proportional relationships form straight lines through the origin.

LabGrades 6, 7· 120 min

Smoothie Fractions: Run the Bar

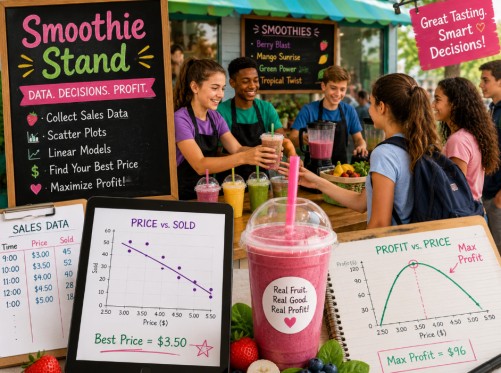
Students run a smoothie bar for a day, and every decision is a fraction problem with a real purpose. Six connected, auto-graded interactive worksheets covering multiply, divide, equivalent fractions, compare, and order. Carry-forward story keeps math meaningful. Common Core aligned. Run it in a day or across two weeks.

Mini LabGrade 7· 20 min

Budgeting for Thanksgiving Feast

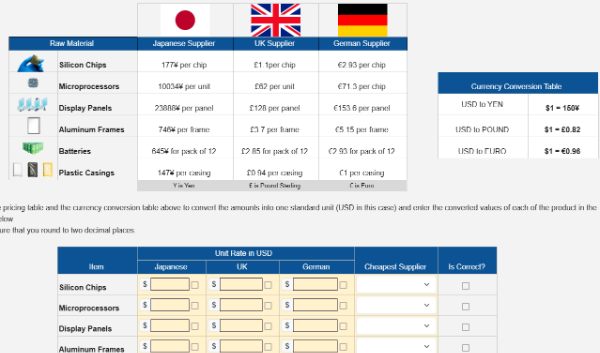
In this Thanksgiving-themed math worksheet, students convert ingredient quantities into standard units and calculate the cost of preparing a holiday meal. It’s a real-world activity that strengthens unit conversion, proportional reasoning, and budgeting skills.

Mini LabGrades 7, 8· 20 min

Community Kitchen - Weekly Budget Planning

In this community kitchen budgeting activity, students convert recipe quantities and calculate the cost of each ingredient needed to prepare a holiday-style meal. Includes turkey, mashed potatoes, gravy, carrots, peas, cranberry sauce, and more.