Bring real-world math to life with this engaging Black Friday Discount Decision Maker worksheet! In this interactive activity, students take on the role of smart shoppers comparing deals across three stores—each offering different types of discounts such as percent-off, flat-amount discounts, BOGO offers, and combo deals. Students calculate final prices, identify the best bargains, and make purchasing decisions just like they would in a real shopping scenario.
This worksheet helps students apply percent calculations, proportional reasoning, and multi-step problem-solving in a way that feels meaningful, relatable, and fun. Students first analyze discounts for 10 different products by computing the price after each type of discount and determining the cheapest store. Then, in Step 2, they create their own Black Friday shopping cart while staying under a fixed ₹6,500 budget, reinforcing budgeting skills and financial literacy.
The activity supports immediate validation and auto-grading, and it can be assigned digitally through the TeachRealMath platform. Teachers can enable randomization so every student receives different discount values, preventing copying and promoting independent thinking.
Perfect for Grade 7 percent applications, holiday-themed lessons, or real-life math practice, this worksheet builds confidence in comparing prices, understanding sales tactics, and calculating savings. It’s a great way to show students how math is used every day—especially during big shopping events like Black Friday!
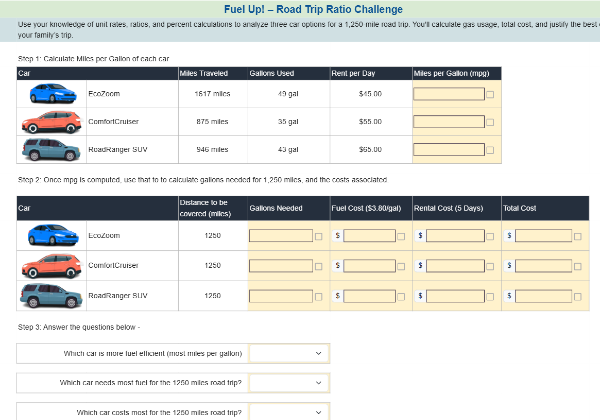
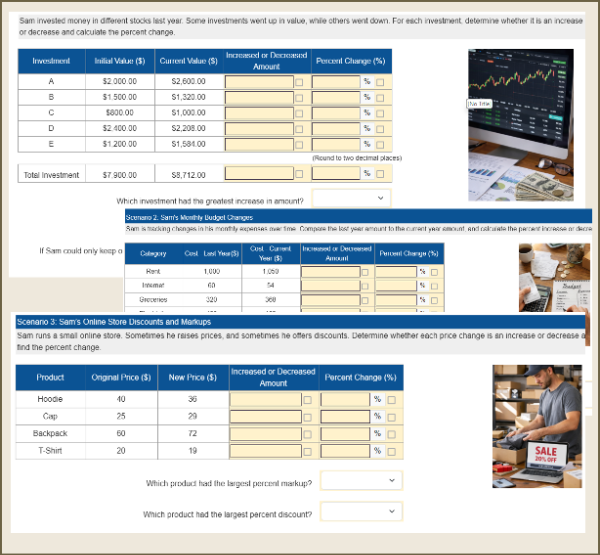
Students will calculate percent discounts, flat discounts, and mixed promotional offers to determine the final price of products across multiple stores. They will compare prices, identify the cheapest option, and make purchasing decisions within a fixed budget, applying multi-step calculations and real-world financial reasoning.
If randomization is enabled, every student will receive a unique version of this worksheet. The original prices and the discounts offered by each store will be different for every student. This prevents copying and ensures each student works independently on their own personalized Black Friday shopping scenario.
💡 Tip: When assigning this activity to your classroom, you can optionally enable randomization to give each student a unique version of the problems. When you re-assign the same worksheet, each student will get a new set of questions, helping them master the content through repeated practice.