Build the Dot Plot: Interactive Grade 6 Dot Plot Worksheet (6.SP.B.4)
An auto-graded, interactive dot plot activity where sixth graders build the plot themselves. Students read a class data set and tap + under each value on the number line to place a dot. Dots stack as they go, mistakes are one tap to undo, and every stack is checked the moment they press Validate. No drawing tools, no paper, no grading pile.
What students do
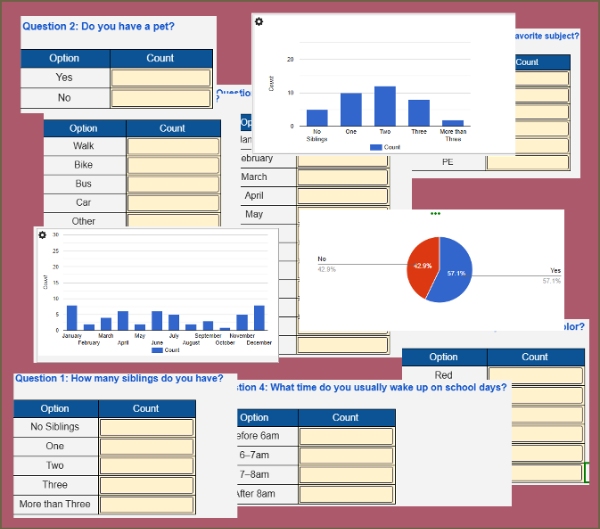
- Read a short class survey (pets at home, books read, hours of sleep, letters in a first name, siblings) with 13 to 16 raw values.
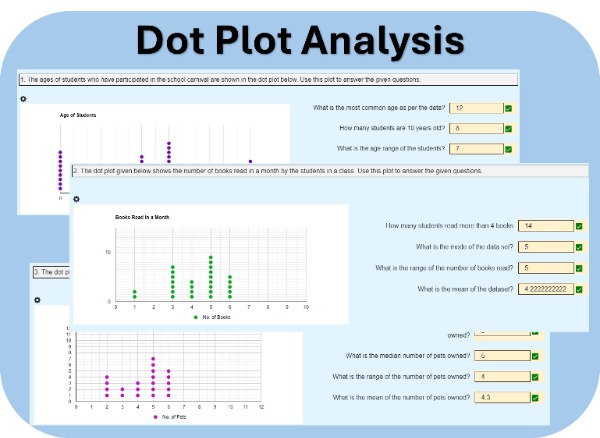
- Click to add dots: tap + under a number to place a dot, tap a dot to remove it, Clear plot to start over. A live counter shows dots placed out of n.
- Press Validate. Correct stacks turn green, wrong stacks turn red, and the feedback says exactly what to fix.
- Answer four read-off questions from their own plot: how many had exactly a value, more than or fewer than a threshold, which value has the tallest stack, where the data is bunched, and which value sits apart from the rest.
- Finish with one sentence on what the dot plot showed that the raw list did not.
Why teachers like it
- Fully auto-graded, with a progress bar that fills as each plot is completed correctly. One reflection question is left for you to read.
- Randomized per student. Each student gets a different data set and different question values, so answers can’t be copied and the activity can be reused.
- Data shapes are designed, not random noise. Every plot shows a clear bunch, a single tallest stack and, where asked, exactly one outlier, so students start noticing clusters, gaps and shape.
- Number lines are wider than the data on purpose, so empty ticks and lone values are visible.
- Hints only on Problem 1, then the scaffold comes away.
- Works on Chromebooks, tablets and laptops. Tap targets are sized for touch.
Standards and fit
- CCSS 6.SP.B.4: display numerical data in plots on a number line, including dot plots.
- CCSS 6.SP.B.5a: report the number of observations.
- Builds toward 6.SP.A.2 and 6.SP.B.5c by having students describe clusters, peaks and outliers in plots they made themselves.
- Grade 6, about 20 minutes, 5 problems. Skill practice or warm-up before mean, median and MAD.
Keywords: dot plot worksheet, grade 6 statistics, 6.SP.B.4, interactive math activity, auto-graded worksheet, data displays, number line, clusters and outliers, distribution shape, middle school math, Chromebook math activity.
Students turn five raw lists of class data into dot plots by placing one dot per value on a number line. They then read counts, the tallest stack, clusters and a value that sits apart directly from their plot. This builds fluency in displaying numerical data on a number line and in reporting the number of observations (6.SP.B.4, 6.SP.B.5a), and it introduces seeing a distribution’s shape.
The worksheet supports randomization. If you enable it every students will receive different data set to plot. This prevent copying of answers.
💡 Tip: When assigning this activity to your classroom, you can optionally enable randomization to give each student a unique version of the problems. When you re-assign the same worksheet, each student will get a new set of questions, helping them master the content through repeated practice.