How Spread Out? Deviations and MAD | Grade 6 Mean Absolute Deviation Worksheet (6.SP.B.5c)
An average only tells half the story. In this interactive Grade 6 statistics worksheet, students help Coach Diaz of the Lakeview Lions pick shooters she can count on for the playoffs. Some players score about the same every game, and some go hot and cold. Students measure how spread out each player’s points are by calculating the mean absolute deviation (MAD), aligned to CCSS 6.SP.B.5c.
What students do
For each player, students follow the same clear routine:
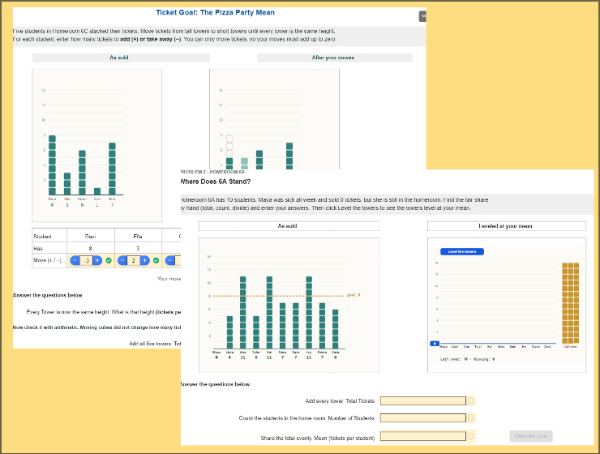
- Find the mean. Add the game scores and divide by the number of games. A dashed mean line appears on the graph.
- Find each deviation. Work out how far each game’s score is from the mean, using + for above and − for below. A balance check confirms the deviations add to 0.
- Find the MAD. Drop the signs to get each distance (absolute value), add the distances, and divide by the number of games.
- Interpret it. Choose what the MAD tells the coach: on average, how many points a player’s scores sit away from their mean.
A visual that catches mistakes
Each card shows the player’s scores on a number line, one row per game. Every deviation a student types draws an arrow from their mean line. A correct arrow lands right on the game’s dot and turns green. A sign error sends the arrow the wrong way, so students can see and fix their own mistakes. The MAD step unlocks only after every deviation is correct, so the MAD is always built from the student’s own work.
The final challenge: same average, different spread
On the last card, two players have exactly the same mean. Students find each player’s mean, distances and MAD, then decide who is the more consistent shooter. Side-by-side dot plots with shaded MAD bands show why the player with the smaller MAD is the steadier choice. This is the key idea behind measures of variability.
Built-in progression
- Card 1 includes hints to get students started.
- Card 3 produces a decimal MAD, so students practice dividing with decimals.
- Card 4 removes the scaffolding and asks students to compare and decide.
Why teachers like it
- Randomized for every student: each attempt gets new scores and averages, so students can’t copy answers. Every version gives whole-number means and clean MADs.
- Auto-graded: 43 points with instant feedback on every answer.
- Engaging context: a basketball coach choosing a reliable player makes variability meaningful.
- Ready to assign: works as skill practice, homework, a math center, or a review before a statistics test.
Skills covered
Mean as a measure of center, deviation from the mean, absolute value and distance, mean absolute deviation (MAD), reading and comparing dot plots, dividing with decimals, and interpreting variability in context.
This is a good fit for 6th grade math teachers looking for a standards-aligned MAD activity that builds real understanding of variability rather than just practicing a formula.
Students compute the mean, each signed deviation from the mean, and the mean absolute deviation for basketball players’ scores. They then interpret the MAD in context and use it to compare two players with the same average. This builds an understanding of MAD as a measure of variability and how it describes consistency (6.SP.B.5c).
The worksheet supports randomization. If you enable it every students will receive different data sets to work. This prevents copying of answers.
💡 Tip: When assigning this activity to your classroom, you can optionally enable randomization to give each student a unique version of the problems. When you re-assign the same worksheet, each student will get a new set of questions, helping them master the content through repeated practice.